
Introduction
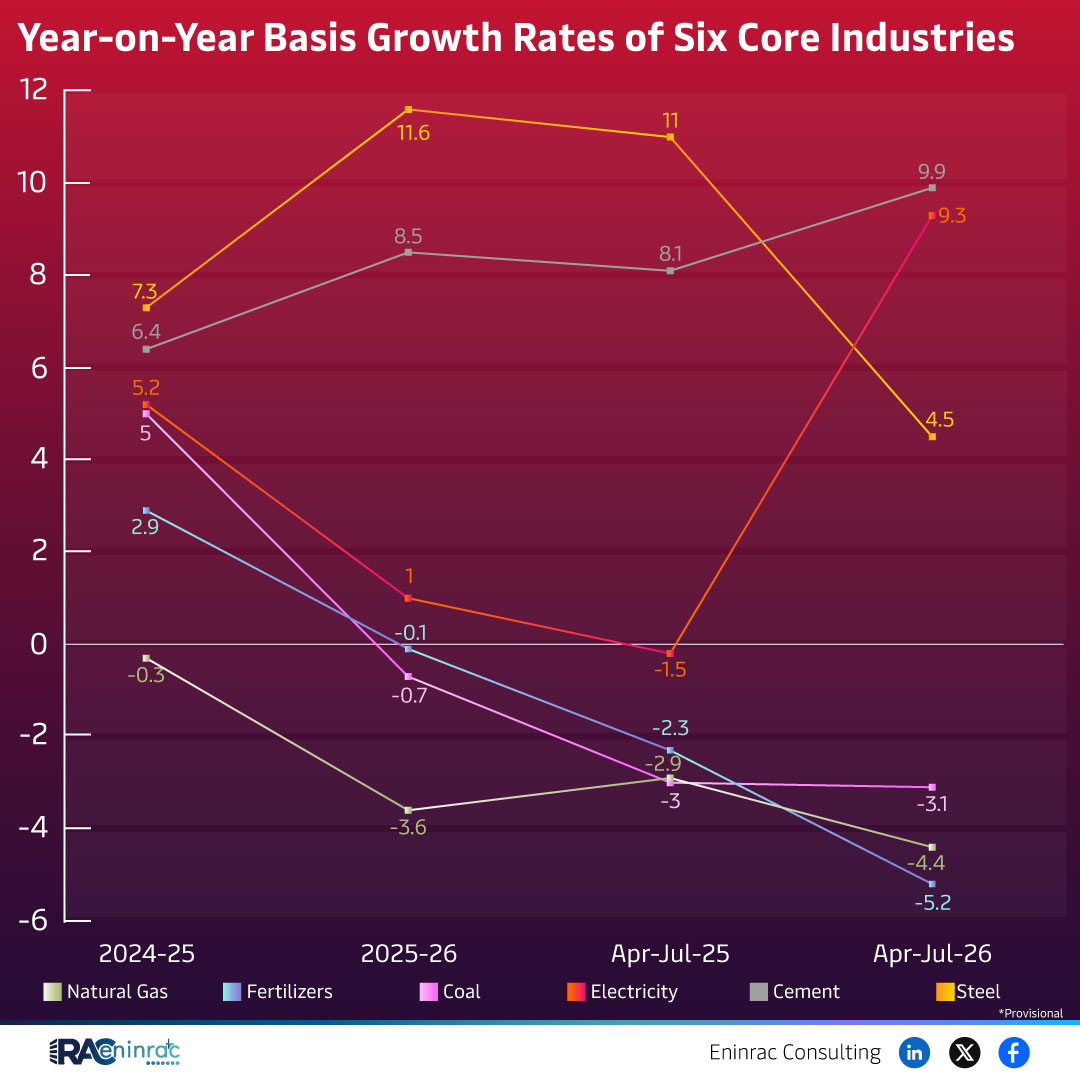
The provisional year‑on‑year growth rates for six core industries—natural gas, fertilizers, coal, electricity, cement and steel—have been released for the fiscal periods 2024‑25 and 2025‑26. Understanding these figures is essential for investors, policymakers, and business leaders who need to gauge the health of the economy and anticipate future demand across energy‑intensive sectors. This article breaks down the data, highlights key trends, and explains how the numbers may influence strategic decisions.
What Does the Data Reveal About This Topic?
What does the raw data tell us about the performance of the six core industries? The provisional figures suggest a moderate but uneven expansion. Natural gas shows the highest growth at around 11.6% year‑on‑year, while the other sectors hover near 10%, indicating a broadly positive outlook but with sector‑specific dynamics that merit closer examination.
Provisional Growth Outlook for 2024‑25 and 2025‑26
When we compare the two fiscal windows, the growth trajectory appears relatively stable. Natural gas maintains a leading position, driven by higher demand for cleaner fuel and favorable pricing. Fertilizers and coal exhibit comparable gains, reflecting steady agricultural demand and continued reliance on coal for power generation despite a gradual shift toward renewables. Electricity growth is buoyed by increased industrial consumption, while cement and steel—collectively representing the MSteel segment—show solid expansion, underscoring ongoing infrastructure projects and urban development.
Impact on Sectors and Industries
The year‑on‑year growth rates of these core industries have ripple effects across multiple layers of the economy. Energy‑focused investors can spot opportunities in natural gas pipelines and coal logistics. Cement and steel producers may benefit from government‑backed infrastructure spending, while fertilizer manufacturers can align production with rising agricultural needs. Policymakers must balance support for these conventional sectors with the transition to renewable energy, ensuring that growth does not exacerbate environmental concerns.
Key Takeaways
- Natural gas leads with an 11.6% YoY increase, signaling strong demand.
- Fertilizers, coal, electricity, cement and steel all show roughly 10% growth.
- Growth remains consistent across 2024‑25 and 2025‑26 provisional periods.
- Infrastructure and urbanization drive cement and steel expansion.
- Energy transition pressures persist despite solid conventional sector performance.
- Investors should monitor policy shifts affecting conventional energy and industrial output.
FAQs
Why are natural gas growth rates higher than other sectors?
Higher growth reflects increased use of cleaner fuel for power and industrial processes, supported by favorable pricing.
What does a 10% growth figure mean for the fertilizer industry?
It indicates steady agricultural demand and potential for expanded market share in food production.
How might coal’s growth affect renewable energy targets?
Continued coal expansion may challenge short‑term renewable goals, requiring balanced policy measures.
Are cement and steel growth tied to specific government projects?
Yes, large infrastructure and housing initiatives are major drivers of their 10% year‑on‑year gains.
What should investors watch for in the next fiscal year?
Key signals include policy changes, commodity price trends, and infrastructure spending plans.