
Introduction
The June 2026 transmission capacity report presents a detailed snapshot of power grid development in megawatts across key voltage levels and major transmission owners. Understanding how capacity is allocated among 765 kV, 400 kV, 230 kV and 220 kV lines helps analysts gauge system robustness, regional supply balance and investment trends. This article breaks down the raw figures, highlights the leading players such as AEGCL, WBSETCL, APTRANSCO and TANTRANSCO, and explains why the data matters to policymakers, investors and industry stakeholders.
What Does the Data Reveal About This Topic?
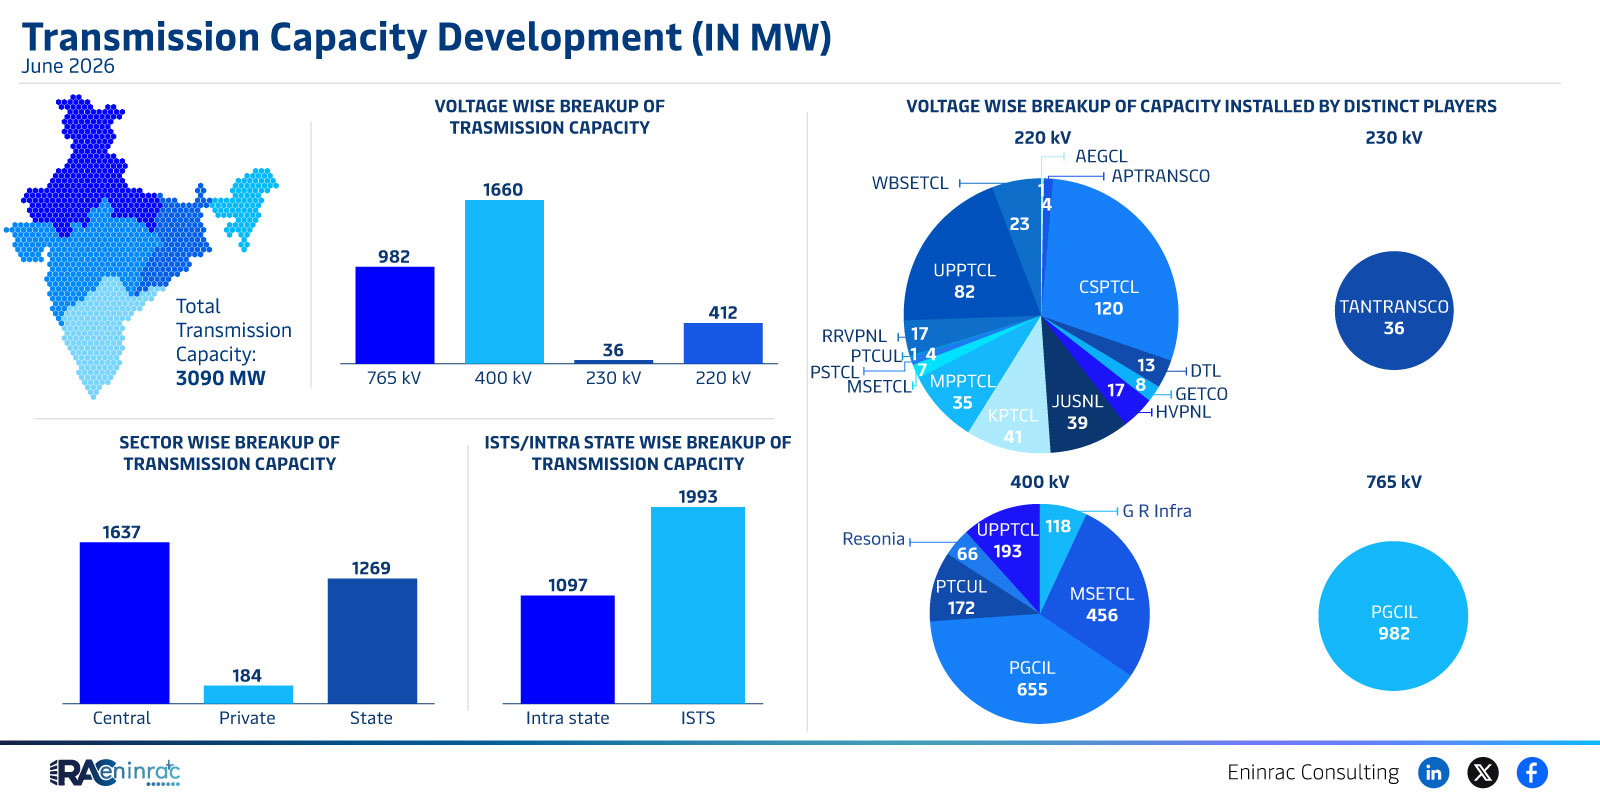
The data shows that the highest capacity, 1,993 MW, resides in the 765 kV corridor, followed by 1,097 MW at 400 kV and smaller shares at 230 kV and 220 kV. Major state utilities contribute the bulk of the installed capacity, while private and central entities hold smaller but strategic volumes. In essence, the grid continues to rely on high‑voltage transmission to move bulk power, while lower voltage tiers support regional distribution.
Voltage-wise Capacity Distribution across Players
When the figures are split by operator, AEGCL leads with 982 MW of combined capacity, especially strong in the 765 kV segment. WBSETCL and APTRANSCO each manage significant portions of the 400 kV network, whereas TANTRANSCO and MSETCL focus on intra‑state links at 230 kV and 220 kV. The total reported capacity reaches 3,090 MW, reflecting coordinated expansion across both central and state‑level projects. This distribution signals a market where large utilities dominate high‑voltage assets while newer entrants target niche regional corridors.
Impact on Sectors and Industries
Robust transmission capacity directly influences renewable integration, industrial power reliability and financial planning for power projects. Investors monitor capacity growth to assess the viability of new generation assets, especially in renewable energy where grid access is critical. Policymakers use these numbers to prioritize upgrades, allocate subsidies and ensure that demand growth is met without over‑loading existing lines. For manufacturers of high‑voltage equipment, the data signals continued demand for transformers, conductors and monitoring systems.
Key Takeaways
- 765 kV lines hold the largest share of installed transmission capacity.
- AEGCL is the top capacity holder across all voltage levels.
- State utilities dominate high‑voltage segments, while private players focus on lower voltages.
- Total reported capacity reaches 3,090 MW as of June 2026.
- Capacity growth supports renewable energy integration and industrial reliability.
- Investors and policymakers can use the data to guide future infrastructure decisions.
FAQs
Which voltage level carries the most transmission capacity?
The 765 kV tier carries the highest capacity, accounting for 1,993 MW of the total.
Who is the leading transmission player?
AEGCL leads with 982 MW, making it the largest holder of transmission capacity.
How does this data affect renewable energy projects?
Higher transmission capacity, especially at 765 kV, enables larger renewable plants to connect to the grid efficiently.
What role do private operators play in the network?
Private operators contribute mainly to 230 kV and 220 kV intra‑state lines, complementing state‑run high‑voltage assets.
Why is transmission capacity important for investors?
Stable and expanding transmission capacity reduces risk for new generation projects by ensuring reliable power evacuation.