
Introduction
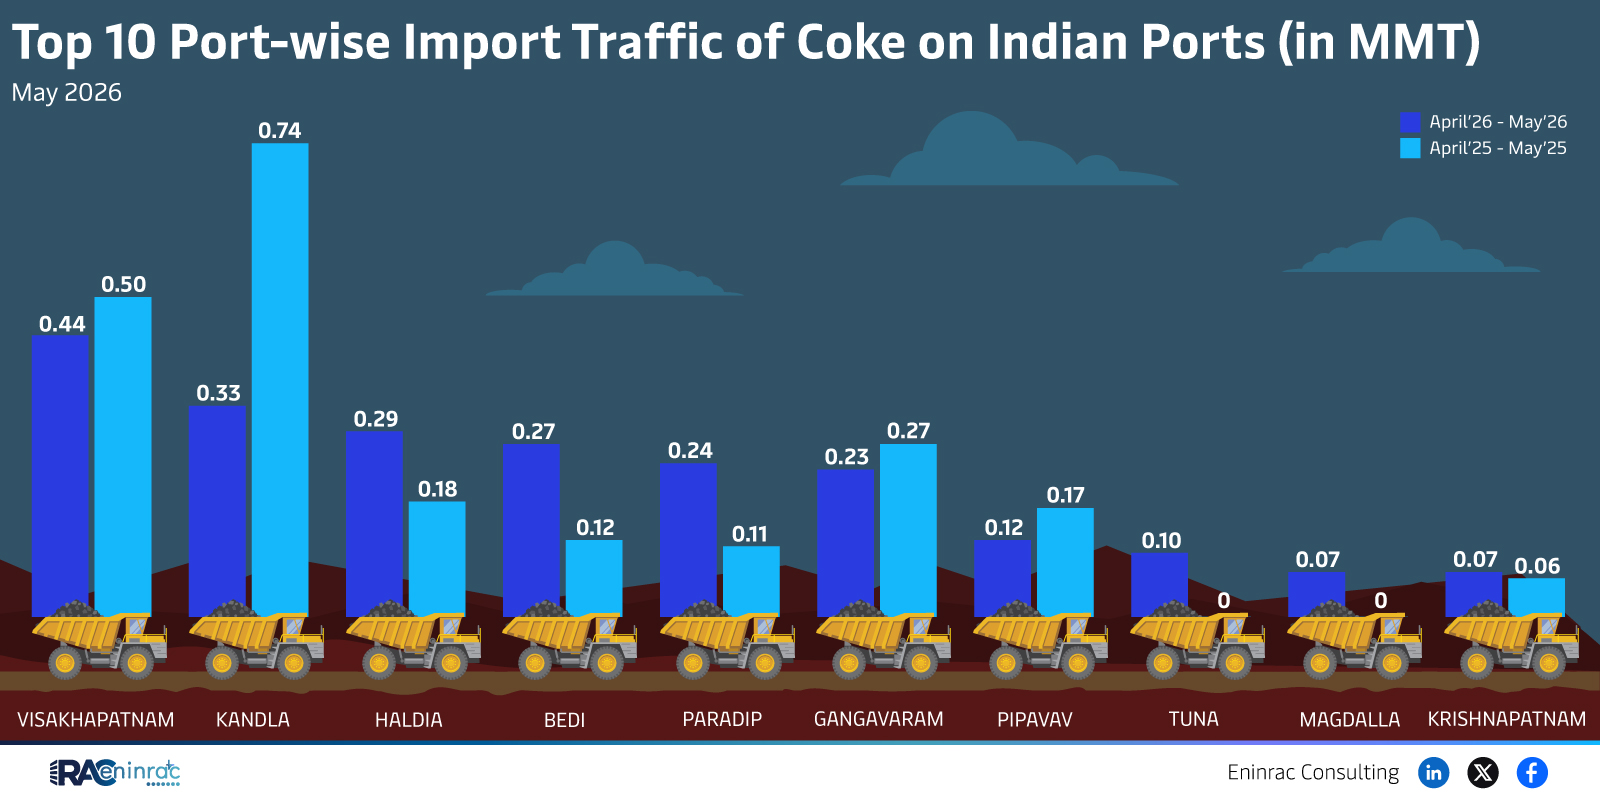
The latest May 2026 report from ninrac Consulting reveals the top ten Indian ports handling coke imports measured in million metric tonnes (MMT). Understanding where coke – a vital fuel for steelmaking and other industrial processes – enters the country helps analysts, investors, and policymakers gauge supply dynamics and regional demand. This article breaks down the port‑wise import traffic, highlights the leading hubs, and explains why these figures matter for the broader conventional energy sector and related industries.
What Does the Data Reveal About This Topic?
Which ports dominate coke import traffic and how do the volumes compare? The data shows Visakhapatnam leading with 0.74 MMT, while Kandla records the smallest share at 0.07 MMT during the April 26–May 26 window. The remaining eight ports—Haldia, Bedi, Paradip, Gangavaram, Pipavav, Tuna, Magdalla, and Krishnapatnam—fall between these extremes, indicating a concentrated flow through a few strategic maritime gateways.
Regional Distribution and Port Performance
Visakhapatnam’s bulk handling capacity and proximity to major steel clusters give it a decisive edge, accounting for roughly 10 % of national coke imports in the observed period. Kandla, despite its status as a western gateway, handles a modest 0.07 MMT, reflecting limited demand in its hinterland or competitive pressure from neighboring ports. Ports such as Haldia and Paradip, located on the eastern coast, capture mid‑range volumes, supporting the heavy industrial belt of West Bengal, Odisha, and Jharkhand. Meanwhile, smaller ports like Bedi and Magdalla serve niche markets, often linked to localized manufacturing hubs.
Impact on Sectors and Industries
Coke import traffic directly influences the conventional energy landscape, especially the steel and cement sectors that rely on coke as a primary reductant. Elevated imports at Visakhapatnam suggest robust steel production activity in the surrounding region, prompting ancillary services such as logistics, warehousing, and freight forwarding to expand. Conversely, lower volumes at Kandla may signal a shift toward alternative fuel sources or a strategic reallocation of raw material supply chains. Investors monitoring commodity price movements can use these port‑level insights to anticipate demand spikes or supply constraints.
Key Takeaways
- Visakhapatnam leads with 0.74 MMT of coke imports, the highest among the ten ports.
- Kandla records the lowest volume at 0.07 MMT, indicating limited regional demand.
- Eight other ports display moderate traffic, highlighting a dispersed yet concentration‑driven import pattern.
- Port performance aligns closely with nearby industrial clusters, especially steel manufacturing hubs.
- Coke import trends serve as a leading indicator for conventional energy consumption in India.
- Stakeholders can leverage this data for investment decisions, supply chain optimization, and policy formulation.
FAQs
What is the significance of coke imports for India’s steel industry?
Coke provides the carbon needed to reduce iron ore in blast furnaces, making it essential for steel production; import volumes reflect domestic production capacity and demand.
Why does Visakhapatnam handle more coke than other ports?
Its deep‑water facilities, proximity to major steel plants, and efficient logistics infrastructure give it a competitive advantage for large‑scale coke handling.
How does coke import traffic affect commodity prices?
Higher import volumes can tighten domestic supply, potentially driving up coke prices, while lower volumes may ease price pressures.
Are there environmental concerns linked to increased coke imports?
Yes, coke combustion releases CO₂ and other pollutants; increased imports may raise scrutiny on emissions and push for cleaner fuel alternatives.
Can the data indicate future shifts in energy sourcing?
Monitoring import trends helps identify whether industries are maintaining reliance on coke or moving toward alternative energy inputs such as natural gas or renewable sources.