
Introduction
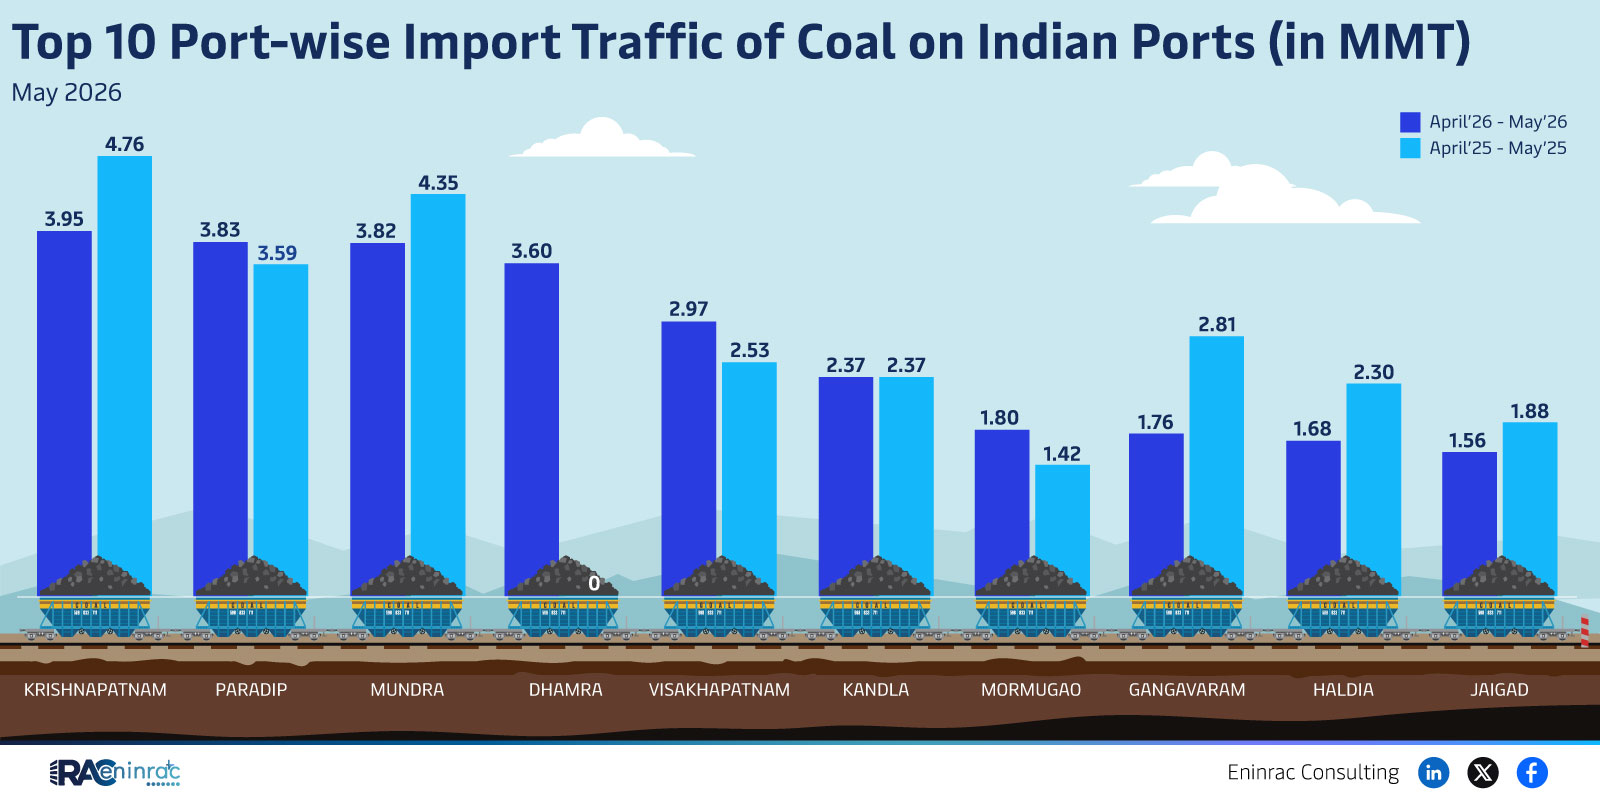
The latest data on coal import traffic for May 2026 reveals how ten major Indian ports performed in moving coal volumes measured in million metric tonnes (MMT). Understanding which ports handle the most coal is crucial for energy analysts, logistics planners, and policymakers because it highlights supply chain bottlenecks, regional demand patterns, and investment opportunities in port infrastructure. This article breaks down the numbers, compares the performance of each port, and explains the broader impact on the Indian energy landscape.
What Does the Data Reveal About This Topic?
The figures show that Krishnapatnam led the rankings with 4.76 MMT, followed closely by Paradip at 4.35 MMT. Both ports together accounted for almost 20 percent of total coal imports during the April‑May window. The data also indicates a slight dip in overall imports compared with the previous month, suggesting seasonal variations or shifting procurement strategies among Indian power generators.
Port‑Wise Performance Comparison
When we compare the ten ports, a clear hierarchy emerges. After Krishnapatnam and Paradip, Mundra handled 3.83 MMT and Dhamra 3.82 MMT, showing a tight contest for the third spot. Visakhapatnam moved 2.97 MMT, while Kandla processed 2.81 MMT. Mormugao and Gangavaram each imported 2.37 MMT, reflecting similar capacity utilization. Haldia recorded 2.30 MMT and Jaigad lagged with 1.80 MMT, indicating lower demand or limited handling capability at those terminals. These differences illustrate regional preferences for coal supply routes and the strategic importance of eastern versus western coast ports.
Impact on Sectors and Industries
Coal import traffic Indian ports directly influences the power generation sector, steel manufacturing, and cement production, all of which rely heavily on coal. Higher volumes at Krishnapatnam and Paradip support the growth of thermal power plants in the eastern states, while the steady flow through Mundra and Dhamra benefits industrial clusters in Gujarat and Odisha. Investors watch these trends to assess the viability of new port‑side logistics hubs, while policymakers use the data to prioritize infrastructure upgrades and environmental regulations.
Key Takeaways
- Krishnapatnam topped coal imports in May 2026 with 4.76 MMT.
- Paradip follows closely, handling 4.35 MMT, together representing nearly one‑fifth of total imports.
- Mundra and Dhamra are tied for third, each moving just over 3.8 MMT.
- Western ports like Kandla and Haldia show moderate activity, reflecting regional demand differences.
- Overall imports dipped slightly from the previous month, indicating possible seasonal effects.
- Port performance shapes investment decisions for logistics, energy, and heavy industry stakeholders.
FAQs
Which Indian port imported the most coal in May 2026?
Krishnapatnam led the rankings, importing 4.76 MMT of coal during the April‑May 2026 period.
How does coal import traffic affect power generation?
Higher import volumes at a port ensure reliable coal supply for nearby thermal power plants, reducing fuel shortages and supporting stable electricity generation.
Why did overall coal imports decline slightly in May 2026?
The modest decline may be due to seasonal demand fluctuations, temporary logistical constraints, or shifts in procurement strategies by large power consumers.
Are there any ports showing significant growth potential?
Mundra and Dhamra, with volumes above 3.8 MMT, are positioned for expansion as they serve fast‑growing industrial corridors on the western and eastern coasts.
What role do policymakers play in coal import logistics?
Policymakers set regulatory frameworks, invest in port infrastructure, and balance environmental concerns with the need for secure energy supplies.