
Introduction
The June 2026 Indian coal import traffic by port data provides a clear picture of how thermal coal moves through the nation’s maritime gateways. Understanding which ports receive the most coal is crucial for energy planners, investors, and policymakers because it influences supply‑chain costs, regional power generation, and future infrastructure needs. This article breaks down the top ten ports by volume, compares the recent period with the previous quarter, and discusses the broader implications for the Indian energy landscape.
What Does the Data Reveal About This Topic?
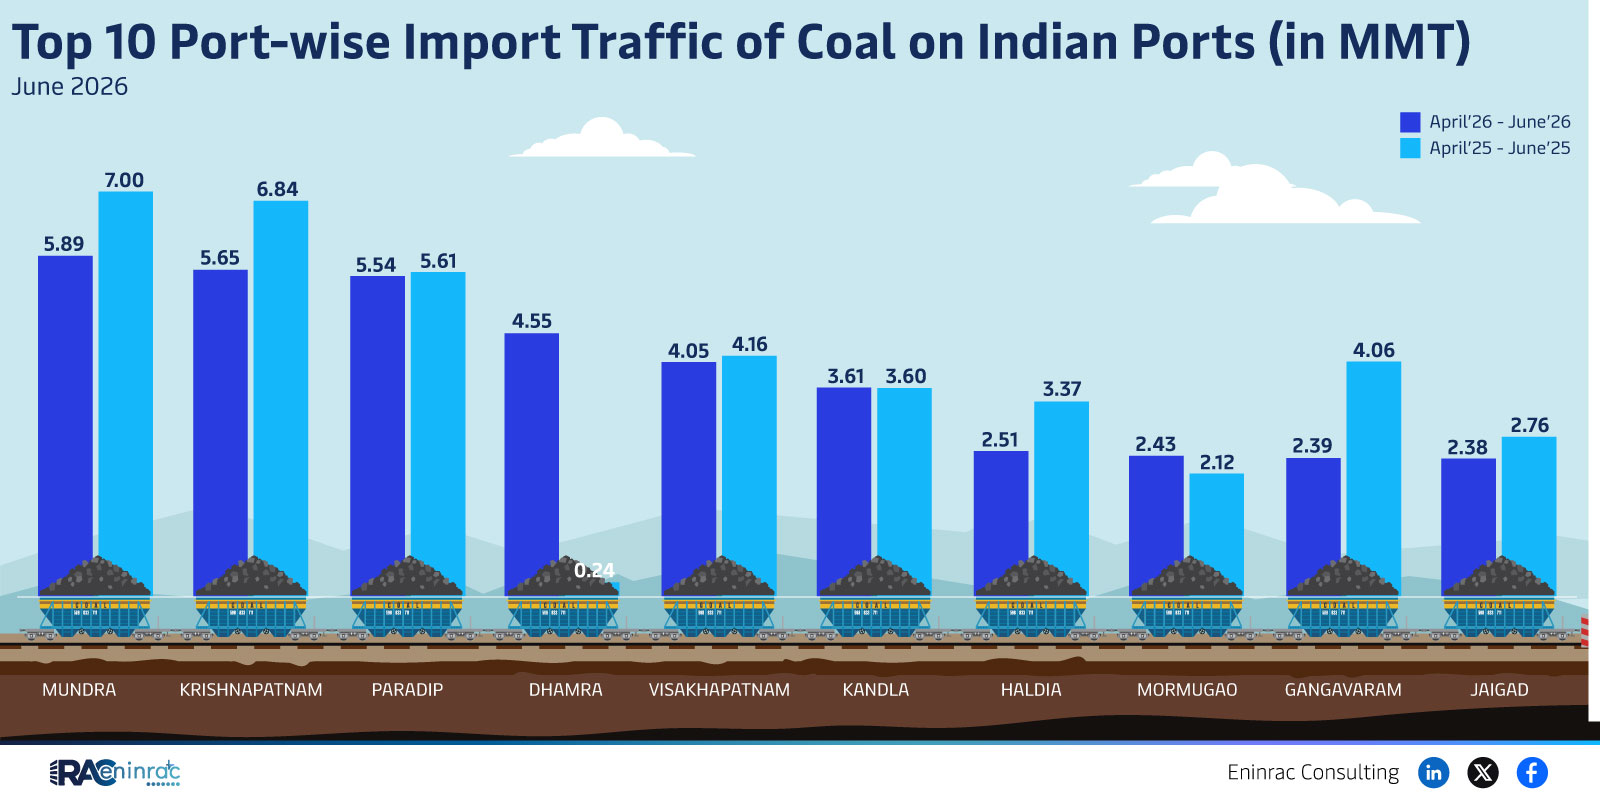
Which Indian ports handled the highest coal imports in the April 26 – June 26 window and how do those figures compare with the April 25 – June 25 period? The data shows Mundra leading with 6.84 MMT, followed closely by Krishnapatnam at 5.89 MMT and Paradip at 5.65 MMT. Most ports experienced a modest dip of 0.1–0.3 MMT compared with the prior month, indicating a slight slowdown in overall import traffic while the ranking of ports remained stable.
Port‑wise Coal Import Volumes – June 2026 Snapshot
When we arrange the ports by import volume, the hierarchy emerges clearly. Mundra (6.84 MMT) stays the dominant entry point, driven by its deep‑draft capabilities and proximity to major coal‑fired power plants in Gujarat and Maharashtra. Krishnapatnam (5.89 MMT) and Paradip (5.65 MMT) maintain their positions as primary conduits for eastern and central demand. Dhamra (5.54 MMT) and Visakhapatnam (5.61 MMT) show a marginal crossover, reflecting shifting logistical preferences. Kandla (4.55 MMT), Haldia (4.05 MMT), Mormugao (4.16 MMT), Gangavaram (3.61 MMT) and Jaigad (3.60 MMT) round out the top ten, each contributing a vital share of the national coal supply chain.
Impact on Sectors and Industries
Coal import volumes directly affect the cost structure of thermal power generation, which still supplies more than 60 % of India’s electricity. Ports with higher throughput, such as Mundra and Krishnapatnam, benefit from economies of scale that can lower freight rates and reduce fuel‑handling charges for power producers. Conversely, smaller ports like Jaigad may see higher per‑ton costs, influencing the competitiveness of nearby industries that rely on cheap power. Investors watch these trends to gauge the viability of port‑expansion projects, while policymakers use the data to prioritize infrastructure upgrades and environmental clearances.
Key Takeaways
- Mundra remains the largest coal‑import gateway with 6.84 MMT in the latest quarter.
- Krishnapatnam and Paradip together account for over 11 MMT, underscoring eastern demand.
- Visakhapatnam slightly overtook Dhamra, indicating a minor shift in southern logistics.
- All top‑ten ports saw a small decline of 0.1–0.3 MMT versus the previous month.
- Port‑specific cost advantages continue to shape regional power‑generation economics.
- Policymakers may need to target capacity upgrades at high‑volume hubs to sustain growth.
FAQs
Which port imported the most coal in June 2026?
Mundra led the list with 6.84 MMT of imported coal.
Did any port see a significant change in imports compared with the prior month?
No port experienced a change larger than 0.3 MMT, indicating a relatively stable import pattern.
How does coal import traffic affect electricity prices?
Higher import volumes at efficient ports lower freight and handling costs, which can reduce generation expenses and electricity tariffs.
Are smaller ports like Jaigad at a disadvantage?
Yes, they typically face higher per‑ton logistics costs, which can make regional power more expensive.
What might policymakers do in response to these trends?
They could prioritize dredging, berth expansion, and equipment upgrades at the busiest ports to improve throughput and reduce bottlenecks.