
Introduction
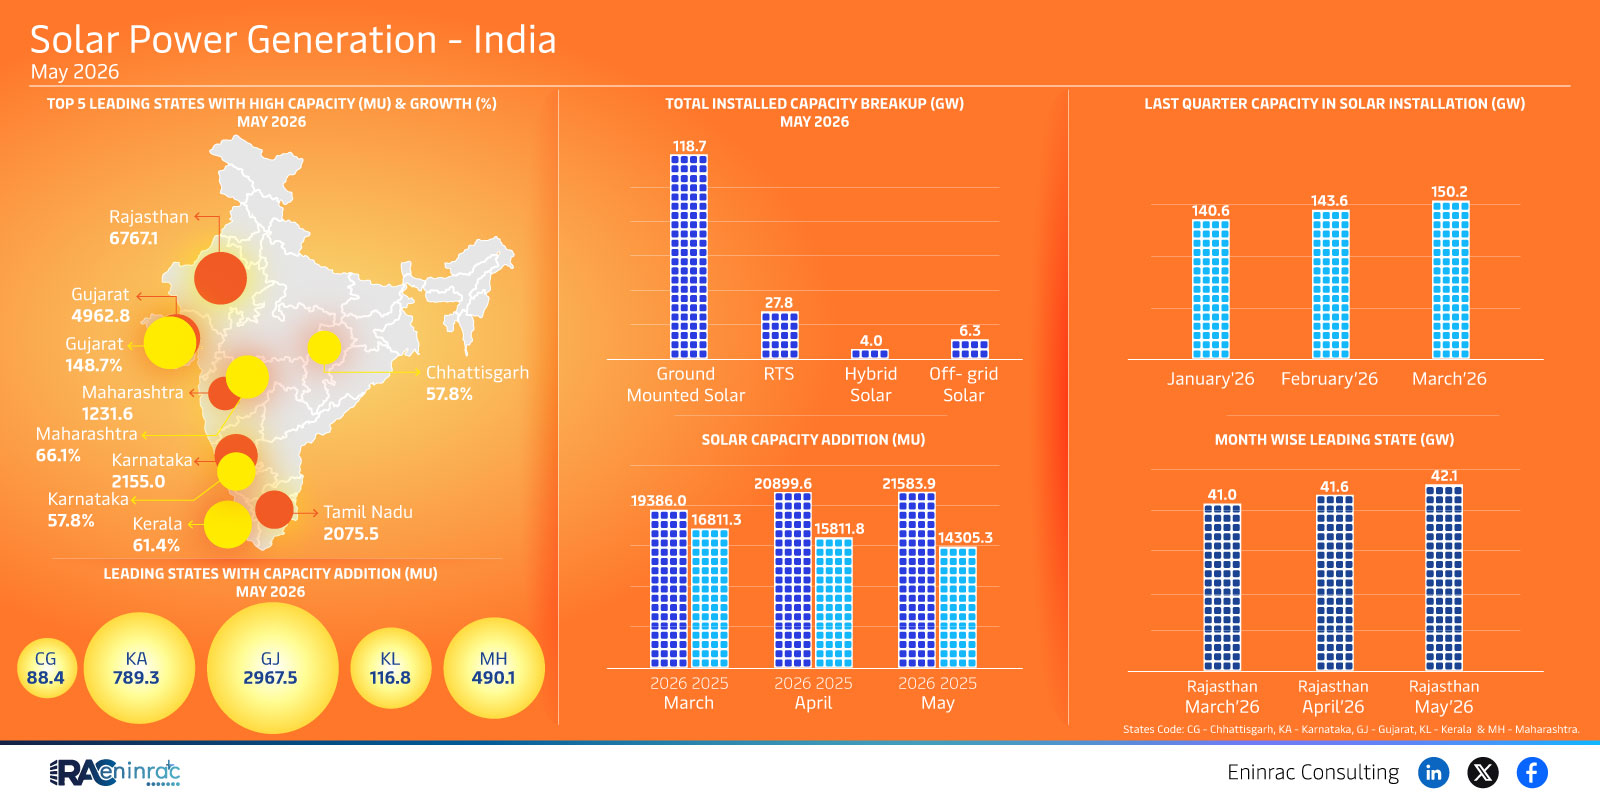
Solar Power Generation India May 2026 provides a snapshot of how the country’s renewable landscape is evolving at the state level. In May 2026, data shows that Tamil Nadu continues to dominate with a capacity of 2,075.5 MW, while Kerala trails with 61.4 MW. Rajasthan emerges as the monthly growth leader, demonstrating the dynamic shift of solar installations across regions. This article unpacks the numbers, explains why these trends matter for investors, policymakers, and industry stakeholders, and highlights the broader impact on India’s clean‑energy transition.
What Does the Data Reveal About This Topic?
The raw figures answer a simple question: which Indian states are driving solar capacity growth in May 2026? Tamil Nadu leads by a wide margin, followed by Kerala, while Rajasthan shows the strongest month‑over‑month increase. The data also points to a substantial total capacity addition of roughly 21,584 MW nationwide, indicating accelerated deployment of ground‑mounted, hybrid and off‑grid solar projects. These insights illustrate how regional policies and resource availability shape the nation’s renewable energy trajectory.
State‑wise Capacity Highlights for May 2026
Analyzing the state‑wise breakdown, Tamil Nadu’s 2,075.5 MW represents almost ninety percent of the top‑five capacity aggregate, underscoring its mature solar market and supportive state incentives. Kerala’s 61.4 MW, though modest, signals growing interest in coastal installations. Rajasthan’s repeated appearance as the month‑wise leader for March, April and May demonstrates the effectiveness of its solar‑friendly policies and expansive land availability. Other notable contributors include Chhattisgarh (CG), Karnataka (KA), Gujarat (GJ), and Maharashtra (MH), each adding measurable megawatts through a mix of ground‑mounted and rooftop projects.
Impact on Sectors and Industries
The surge in solar capacity influences several sectors. For the energy market, increased generation eases pressure on conventional coal plants and improves grid stability. Investors gain confidence from clear growth signals, prompting higher capital inflows into solar project financing and technology innovation. Policymakers can benchmark successful state programs to replicate best practices nationwide. Equipment manufacturers, EPC firms, and land‑use planners also benefit from expanded demand for panels, inverters, and construction services, while consumers enjoy lower electricity costs as solar penetration rises.
Key Takeaways
- Tamil Nadu remains the clear leader in solar capacity for May 2026.
- Kerala shows modest but steady growth, indicating broader geographic diversification.
- Rajasthan outpaces other states in month‑wise capacity addition, highlighting effective policy support.
- Total national capacity addition approached 21,600 MW, signifying rapid deployment.
- Ground‑mounted, hybrid and off‑grid installations all contribute to the growth mix.
- Strong growth impacts investors, policymakers, manufacturers, and end‑users across the energy value chain.
FAQs
Which state had the highest solar capacity in May 2026?
Tamil Nadu, with 2,075.5 MW, topped the list.
How much total solar capacity was added nationwide in May 2026?
Approximately 21,584 MW were added across all states.
What type of solar projects are driving the growth?
Ground‑mounted, hybrid, and off‑grid installations are all contributing significantly.
Why is Rajasthan’s growth noteworthy?
Rajasthan led month‑over‑month capacity addition, reflecting strong state incentives and ample land.
What does this mean for renewable energy investors?
The data signals robust market momentum, encouraging further investment in Indian solar projects.