
Introduction
Solar power generation in India continues to accelerate, and the June 2026 report offers an up‑to‑date snapshot of state‑level performance. Understanding which regions are adding capacity, how total installed capacity evolves, and what these trends mean for the market is essential for investors, policymakers, and industry analysts.
What Does the Data Reveal About This Topic?
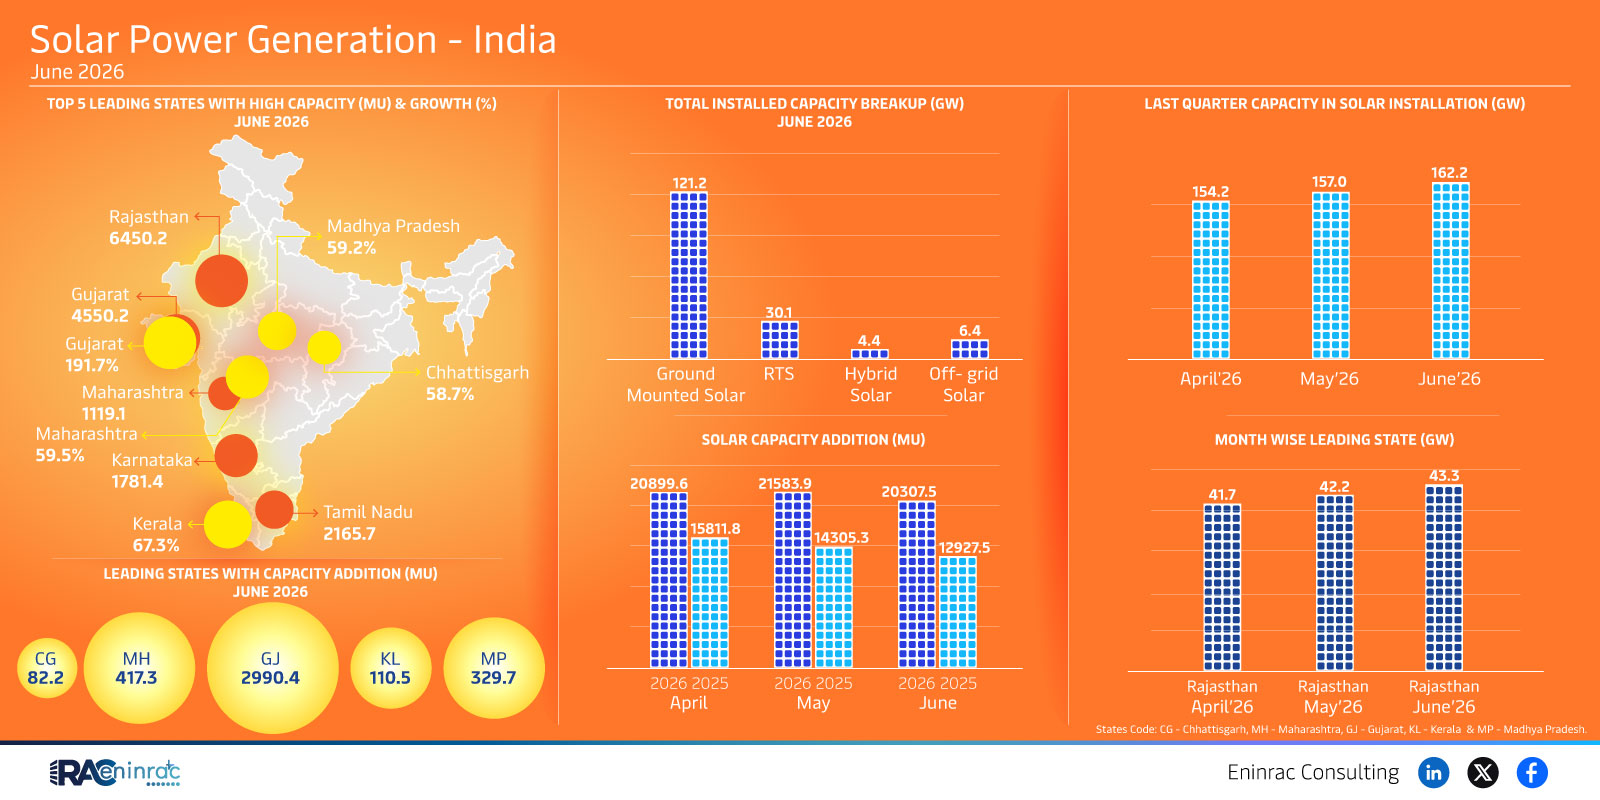
The data shows Tamil Nadu leading with 2,165.7 MW of capacity, while Rajasthan topped monthly additions for April, May and June. The overall installed capacity reached 21,583.9 MW, and last‑quarter additions averaged about 162 GW across the nation. These figures answer the core question: which states are driving India’s solar expansion and how fast is the country adding new capacity?
State‑by‑State Solar Capacity Trends in June 2026
Comparative analysis highlights distinct regional dynamics. Tamil Nadu’s large base reflects strong policy support and abundant ground‑mount installations. Rajasthan’s monthly leadership points to rapid deployment of both ground‑mounted and hybrid‑grid projects. Other notable contributors include Maharashtra, Gujarat, Chhattisgarh, Kerala and Madhya Pradesh, each adding measurable megawatts through a mix of rooftop, ground‑mount, and hybrid systems. The growth pattern underscores a shift from early‑stage rooftop projects to larger utility‑scale farms, especially in arid states with high solar irradiance.
Impact on Sectors and Industries
The surge in solar capacity influences several sectors. Renewable energy developers gain confidence to scale projects, while equipment manufacturers see rising demand for panels, inverters and storage solutions. Financial institutions are presented with a broader pipeline of investable assets, prompting more green financing products. Policymakers can leverage the data to refine incentive structures and grid integration standards, ensuring that rapid capacity addition does not compromise grid stability. Consumers benefit from lower tariffs as economies of scale materialise across the leading states.
Key Takeaways
- Tamil Nadu remains the top state with over 2,100 MW installed capacity.
- Rajasthan leads monthly capacity additions for the first quarter of 2026.
- Total national solar capacity surpassed 21,500 MW, reflecting sustained growth.
- Last‑quarter average additions of 162 GW indicate accelerating deployment.
- Hybrid and ground‑mount projects dominate new installations, especially in arid regions.
- Increased capacity drives investment, manufacturing, and policy focus across the renewable sector.
FAQs
Which state had the highest solar capacity in June 2026?
Tamil Nadu, with approximately 2,165.7 MW of installed solar capacity.
What state led monthly capacity additions in 2026?
Rajasthan topped the list for April, May and June 2026.
How much total solar capacity was installed nationwide by June 2026?
The total installed capacity reached about 21,583.9 MW.
What type of solar projects are driving growth?
Ground‑mount and hybrid‑grid installations are the primary contributors, especially in high‑irradiance states.
Why is this data important for investors?
It highlights the fastest‑growing markets, informs risk assessment, and helps allocate capital to high‑return solar projects.