
Introduction
The Renewable Power Installed Capacity West India August 2026 report provides a snapshot of the region's clean energy landscape. Understanding the total installed capacity, state-wise contributions and technology mix helps investors, policymakers and industry analysts gauge growth trends, plan future projects and assess India's progress toward its renewable energy targets.
What Does the Data Reveal About This Topic?
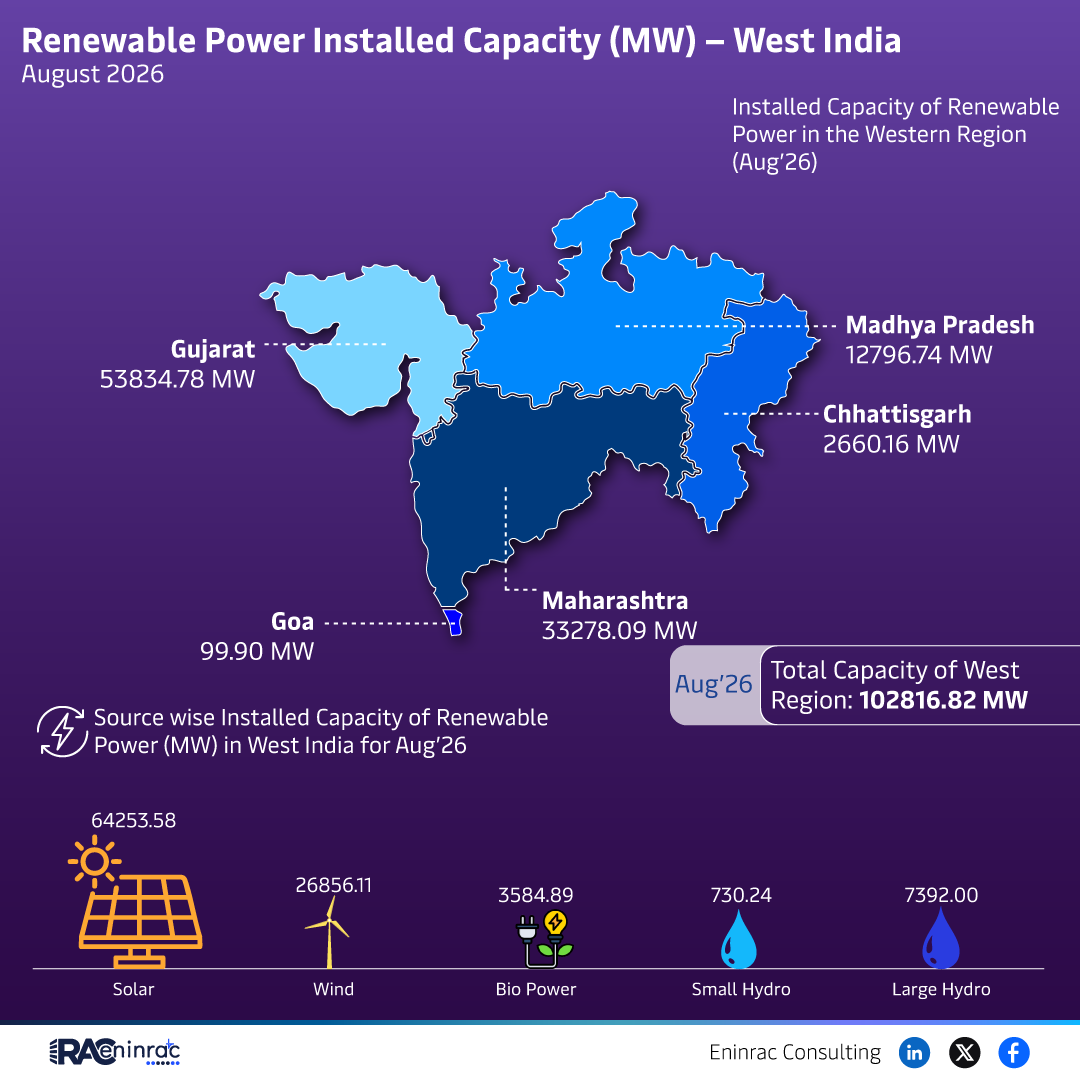
The data shows that the Western region of India reached a cumulative renewable power installed capacity of 102,816.82 MW by August 2026. Gujarat alone contributed roughly 53,834.78 MW, making it the dominant state, followed by Maharashtra with about 33,278.09 MW. Smaller contributors include Madhya Pradesh (12,796.74 MW), Chhattisgarh (2,660.16 MW) and Goa (99.90 MW). The source-wise breakdown indicates solar accounts for over 64,000 MW, wind supplies around 3,584.89 MW, bio‑power about 730.24 MW, small hydro 7,392.00 MW and large hydro a modest share.
State‑wise Capacity Comparison
When comparing the states, Gujarat's capacity is more than four times that of Madhya Pradesh and nearly twenty‑seven times the output of Chhattisgarh. Maharashtra’s 33,278 MW places it second, reflecting strong solar parks and expanding wind farms along the coastal belt. Goa's sub‑100 MW contribution highlights its limited land availability but also its potential for offshore projects. The disparity underscores the influence of policy incentives, grid infrastructure and resource endowments, with Gujarat benefiting from long‑standing solar tariff reforms and Maharashtra leveraging its wind corridors.
Impact on Sectors and Industries
The surge in renewable capacity reshapes several sectors. Power generators are increasingly shifting capital from coal to solar and wind, reducing fuel‑cost exposure. Equipment manufacturers see higher demand for photovoltaic modules, wind turbines and storage solutions, driving domestic supply chains. Financial institutions are creating green bonds and dedicated renewable project funds to meet investor appetite for ESG assets. Policymakers gain leverage to meet national targets of 450 GW by 2030, using the Western region's progress as a benchmark. Consumers benefit from lower electricity tariffs as renewable curtailment declines, while the automotive sector gains from cleaner grid electricity for electric vehicles.
Key Takeaways
- Total renewable capacity in West India reached 102,816.82 MW in August 2026.
- Gujarat holds the largest share with over 53,800 MW, representing more than 52% of the regional total.
- Solar power dominates the technology mix, contributing roughly 64% of the installed capacity.
- Maharashtra ranks second with 33,278 MW, driven by coastal wind farms and expanding solar farms.
- Smaller states such as Madhya Pradesh, Chhattisgarh and Goa collectively add less than 16% of the region's capacity.
- The rapid growth fuels investment in grid upgrades, storage, and domestic clean‑energy manufacturing.
FAQs
What was the total renewable power installed capacity in West India as of August 2026?
It was 102,816.82 MW, covering solar, wind, bio‑power and hydro installations.
Which state contributes the most renewable capacity in the Western region?
Gujarat, with approximately 53,834.78 MW, leads the regional portfolio.
How much solar capacity is installed in West India according to the data?
Solar accounts for about 64,253.58 MW, the largest share among all sources.
Are wind and hydro capacities significant in the Western region’s mix?
Wind provides roughly 3,584.89 MW, while small hydro adds 7,392 MW; large hydro remains modest.
What implications does this capacity growth have for investors?
It signals strong project pipelines, opportunities for green financing, and a favorable environment for clean‑energy technology manufacturers.