
Introduction
South India’s power landscape in May 2026 shows a diverse mix of installed capacity across states and fuel sources. Understanding the distribution of megawatts (MW) helps investors, policymakers, and industry analysts gauge regional growth, energy security, and the shift toward cleaner generation. This article breaks down the latest capacity figures, highlights key trends, and explains what the numbers mean for the broader energy market.
What Does the Data Reveal About This Topic?
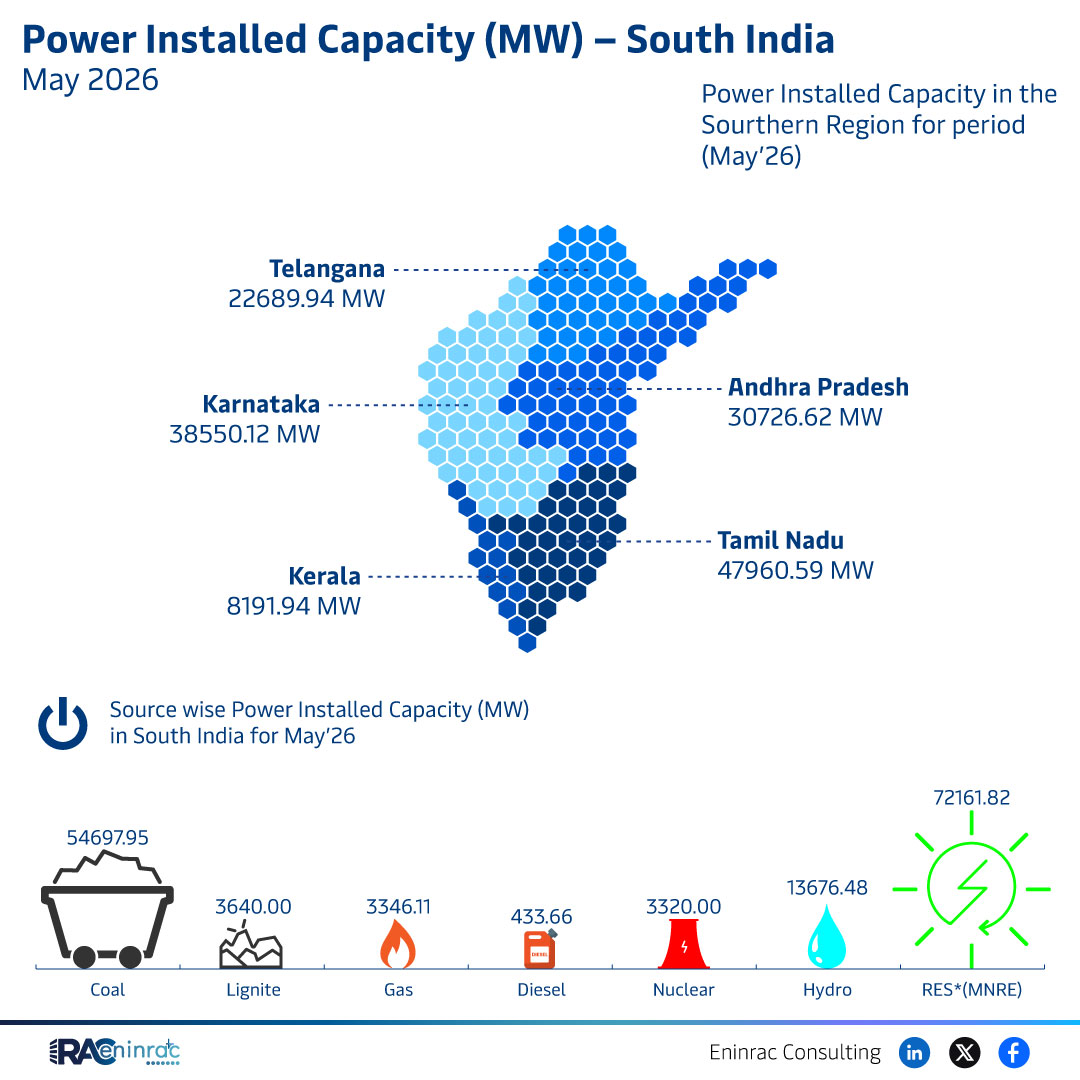
The raw data indicates that Karnataka leads with the highest installed capacity at 38,550.12 MW, followed by Tamil Nadu at 47,960.59 MW and Telangana at 22,689.94 MW. The source‑wise breakdown shows coal, lignite, gas, diesel, and nuclear together contribute a substantial share, while renewable sources such as wind and solar are embedded within the total but not itemised separately. The insight is clear: traditional thermal generation still dominates South India’s capacity mix, yet the sheer size of Karnataka’s portfolio suggests a growing diversification.
State‑Level Capacity Comparison
Karnataka’s 38,550.12 MW dwarfs the 30,726.62 MW reported for Andhra Pradesh and the 8,191.94 MW for Kerala. Tamil Nadu, despite a lower headline figure, shows a strong renewable push in other reports, indicating that its capacity may be increasingly sourced from solar and wind. Telangana’s 22,689.94 MW reflects steady growth driven by both thermal plants and new renewable projects. These variations illustrate how state policies, resource availability, and investment climates shape the installed capacity landscape.
Impact on Sectors and Industries
The dominance of conventional fuels influences coal mining, gas supply chains, and diesel logistics, while also affecting emissions targets set by state governments. Investors in renewable projects must consider the competitive pressure from large thermal bases, yet the data hints at untapped potential for solar and wind in high‑capacity states like Karnataka and Tamil Nadu. Policymakers can use these figures to balance grid reliability with climate commitments, encouraging hybrid models that integrate storage and demand‑response mechanisms.
Key Takeaways
- Karnataka holds the largest installed capacity in South India at over 38,500 MW.
- Traditional thermal sources remain the primary contributors to regional capacity.
- Telangana, Tamil Nadu, and Andhra Pradesh together account for more than 90% of the total capacity.
- Kerala’s modest 8,191.94 MW highlights opportunities for renewable expansion.
- State‑specific policies will drive the pace of transition toward cleaner energy.
- Investors should monitor source‑wise capacity trends to assess risk and growth potential.
FAQs
Which South Indian state has the highest power installed capacity?
Karnataka leads with approximately 38,550 MW of installed capacity as of May 2026.
What are the main fuel sources for South India’s power generation?
The data lists coal, lignite, gas, diesel, and nuclear as the primary sources, indicating a heavy reliance on conventional thermal generation.
Is renewable energy included in the capacity figures?
The raw data does not separate renewable capacity, but states like Tamil Nadu are known to have significant solar and wind installations that contribute to the total.
How does Telangana’s capacity compare to its neighbours?
Telangana’s 22,689.94 MW is lower than Karnataka and Tamil Nadu but higher than Kerala, reflecting balanced growth across thermal and emerging renewable projects.
What implications does this data have for investors?
Investors should note the dominance of conventional sources while seeking opportunities in states showing strong renewable potential, such as Karnataka and Tamil Nadu.