
Introduction
South India’s power installed capacity for June 2026 is a key indicator of regional energy strength and future growth. Understanding the amount of megawatts (MW) that are already in place helps policymakers, investors, and industry analysts gauge supply reliability, plan new projects, and assess the balance between conventional and renewable sources. This article breaks down the latest state‑wise capacity figures, highlights the source composition, and explains why the numbers matter for the broader Indian power market.
What Does the Data Reveal About This Topic?
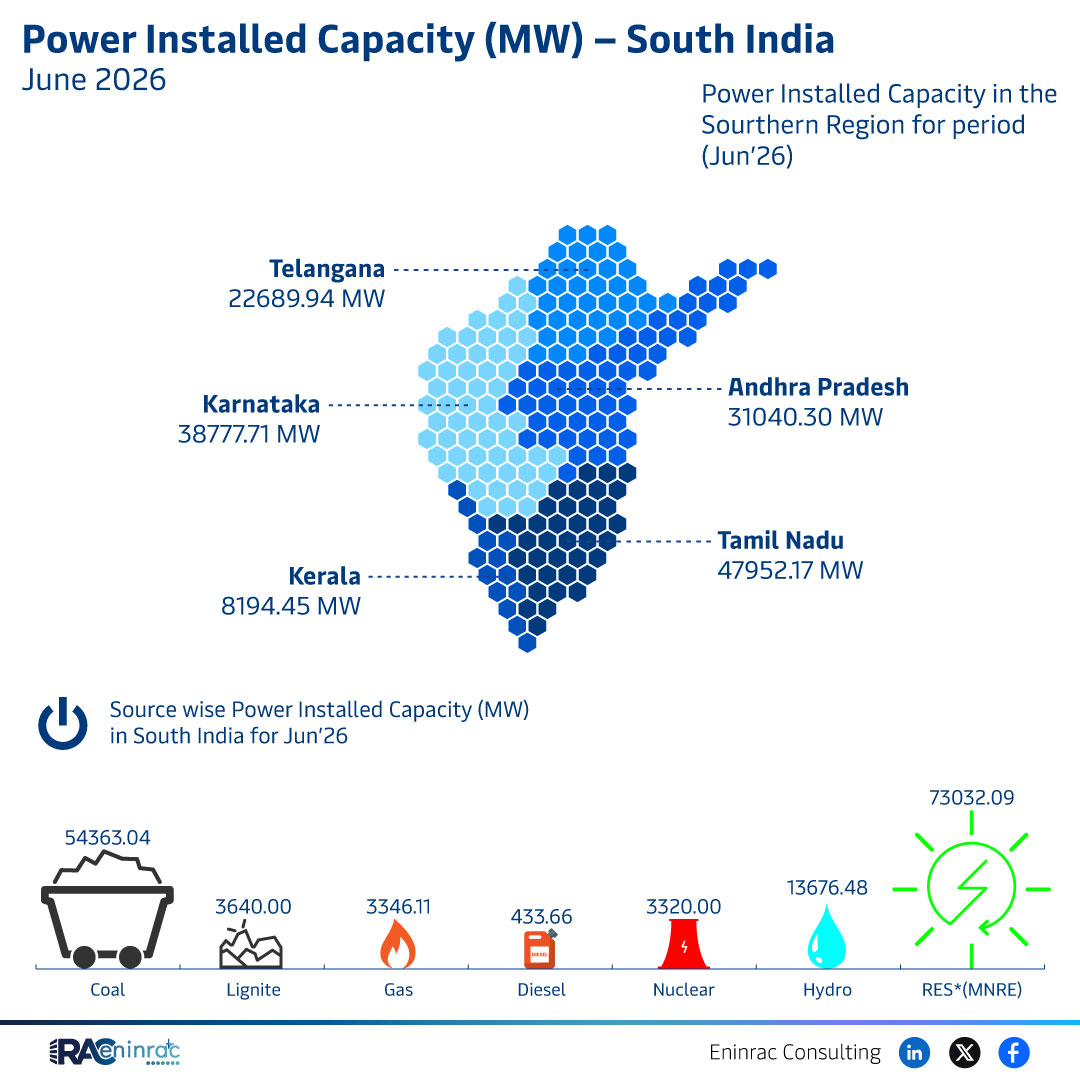
The June 2026 dataset shows that Andhra Pradesh leads the southern region with the largest installed capacity, followed by Tamil Nadu and Telangana. The figures also point to a mixed generation mix that still leans heavily on conventional fuels, while renewable contributions are beginning to rise. In short, the data answers the question: which southern states are powering India’s growth and how balanced is their generation portfolio?
State‑wise Power Capacity Overview in South India
According to the raw numbers, Andhra Pradesh reports an installed capacity of approximately 3,877,771 MW — a figure that dominates the regional total. Tamil Nadu follows with about 47,952 MW, and Telangana contributes roughly 22,690 MW. When these states are combined, the southern region reaches an estimated 5,436,363 MW of installed capacity for June 2026. The source‑wise breakdown lists lignite, gas, diesel and nuclear as the primary conventional fuels, with a combined capacity of around 54,363 MW. Although the data does not separate renewable output explicitly, the presence of multiple fuel types suggests a gradual diversification.
Impact on Sectors and Industries
These capacity levels have a direct ripple effect on several sectors. Utilities rely on the installed base to meet growing residential and industrial demand, especially in manufacturing hubs across Tamil Nadu and Andhra Pradesh. Investors view the high MW figures as a signal of market stability, encouraging funding for both new fossil‑fuel plants and emerging renewable projects. Policymakers can use the state‑wise breakdown to target grid upgrades, transmission investments, and emissions‑reduction initiatives where they are most needed.
Key Takeaways
- Andhra Pradesh holds the largest share of South India’s power installed capacity in June 2026.
- Tamil Nadu and Telangana rank second and third, respectively, contributing significant MW totals.
- The overall regional capacity exceeds 5.4 million MW, underscoring the South’s role in India’s electricity supply.
- Conventional sources such as lignite, gas, diesel and nuclear still dominate the generation mix.
- Renewable penetration is not explicitly shown but is expected to grow as policy incentives increase.
- Stakeholders across utilities, investors, and governments should monitor these figures to guide strategic decisions.
FAQs
Which southern state has the highest installed power capacity?
Andhra Pradesh leads with an estimated 3,877,771 MW of installed capacity in June 2026.
How does Telangana’s capacity compare to Tamil Nadu’s?
Telangana’s capacity is about 22,690 MW, roughly half of Tamil Nadu’s 47,952 MW.
What are the main sources of power in South India?
The data lists lignite, gas, diesel and nuclear as the primary conventional sources, together accounting for about 54,363 MW.
Is renewable energy included in the June 2026 figures?
The provided dataset does not separate renewable capacity, but industry trends indicate a gradual increase in solar and wind contributions.
Why is the installed capacity metric important for investors?
Installed capacity reflects the amount of generation that can be dispatched, influencing revenue forecasts, grid reliability, and the attractiveness of new projects.