
Introduction
The June 2026 snapshot of Power Installed Capacity North India offers a comprehensive view of how the region’s electricity landscape is evolving. With a total installed capacity of over 66 GW, the data highlights the contributions of each state and the mix of conventional and renewable sources. Understanding these figures is essential for investors, policymakers, and industry analysts who need to gauge growth trends, identify opportunities, and plan for future demand. This article breaks down the state‑wise capacity, examines the fuel‑type distribution, and discusses the implications for the broader energy market.
What Does the Data Reveal About This Topic?
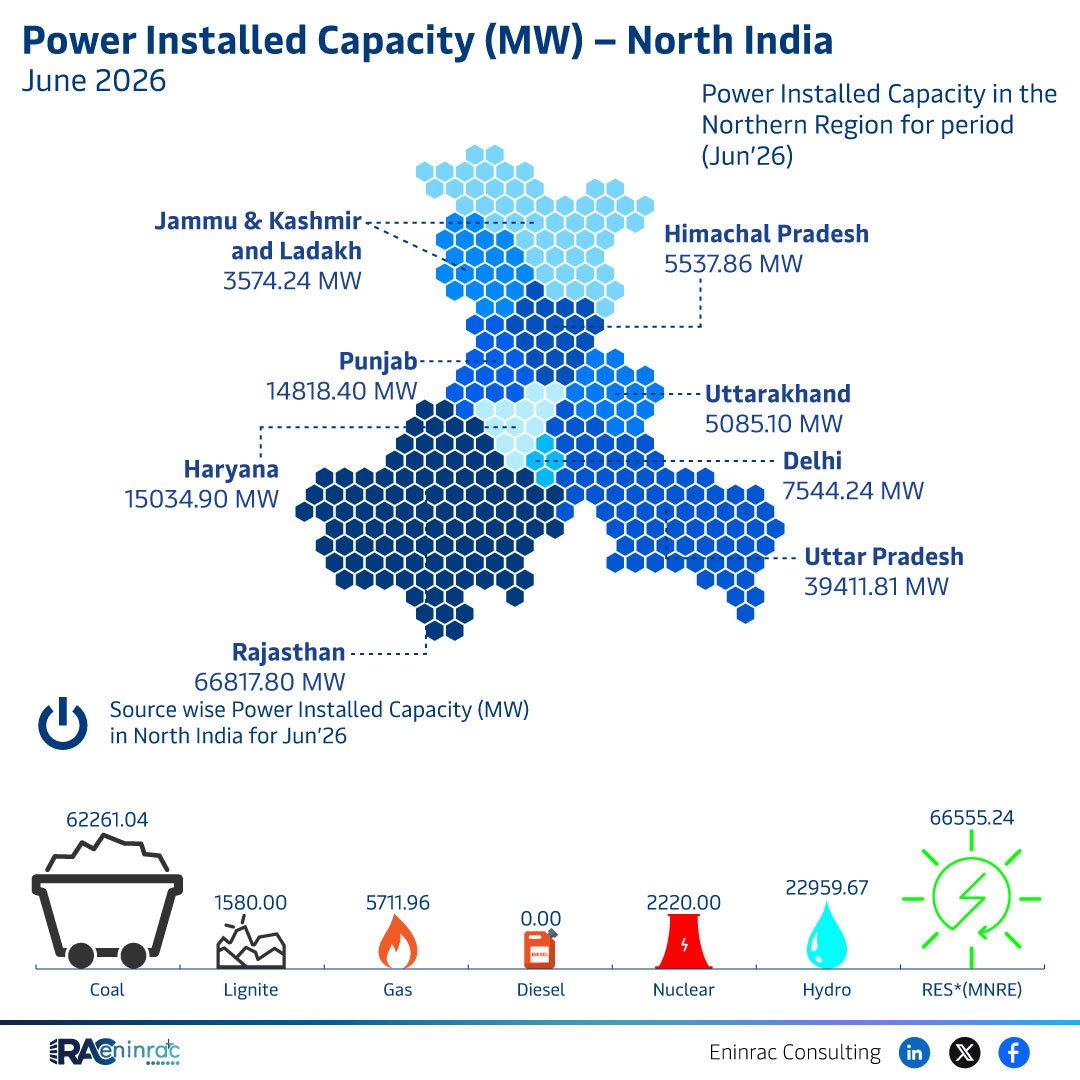
What does the June 2026 data tell us about power capacity in North India? It reveals that Rajasthan leads with more than 66 GW of installed capacity, followed closely by Uttar Pradesh at roughly 39 GW. The combined capacity of Punjab, Haryana, and Delhi contributes another 15 GW, while the smaller northern states such as Jammu & Kashmir, Himachal Pradesh, and Ladakh together account for just under 5 GW. The fuel‑type breakdown shows coal and lignite still dominate, but renewable sources like hydro, solar and wind together provide a growing share, indicating a gradual shift toward cleaner energy.
Regional Comparison of Installed Capacity by State
Examining the state‑wise figures uncovers stark contrasts in development. Rajasthan’s installed capacity of 66,818 MW dwarfs the next highest figure in Uttar Pradesh, which stands at 39,412 MW, reflecting the state’s aggressive expansion of both thermal and renewable projects. Punjab’s 14,818 MW and Haryana’s 15,035 MW highlight the importance of agricultural‑driven demand and industrial growth in the Punjab‑Haryana corridor. Delhi, despite its smaller land area, contributes 7,544 MW, driven largely by solar rooftops and gas‑based plants. In the mountainous regions, Jammu & Kashmir, Himachal Pradesh and Ladakh together add just over 5 GW, underscoring the challenges of terrain and lower population density in deploying large‑scale infrastructure.
Impact on Sectors and Industries
The capacity distribution has direct implications for multiple sectors. For power generators, the dominance of coal and lignite suggests continued reliance on conventional fuels, yet the rising share of hydro, solar and wind opens avenues for renewable project financing. Equipment manufacturers can target the northern market for turbine, solar panel and storage solutions. Investors see Rajasthan and Uttar Pradesh as prime zones for long‑term contracts, while policy makers must balance environmental goals with energy security, especially in the Himalayan states where grid extension is costly. The data also informs utilities planning grid upgrades, demand‑side management, and regional power trade agreements.
Key Takeaways
- Rajasthan holds the largest installed capacity in North India, over 66 GW.
- Uttar Pradesh is the second‑largest contributor with roughly 39 GW.
- Coal and lignite remain the primary fuel sources across the region.
- Renewable sources collectively exceed 10 GW, showing steady growth.
- Himalayan states contribute under 5 GW, highlighting geographic constraints.
- Investors should focus on Rajasthan, Uttar Pradesh, and emerging renewable projects.
FAQs
What is the total power installed capacity in North India as of June 2026?
The region reached a total installed capacity of approximately 66,818 MW in June 2026.
Which states have the highest installed capacity?
Rajasthan leads, followed by Uttar Pradesh, Punjab and Haryana, which together account for a significant share of the total.
How does the fuel mix compare between conventional and renewable sources?
Coal and lignite dominate the mix, but renewables – hydro, solar and wind – together provide over 10 GW, indicating a growing share.
What challenges do the mountainous northern states face in expanding capacity?
Harsh terrain, low population density, limited land availability and high grid‑extension costs make large‑scale projects difficult.
How can investors use this data for decision‑making?
They can target high‑capacity states for long‑term power purchase agreements, focus on emerging renewable projects, and assess policy incentives across the region.