
Introduction
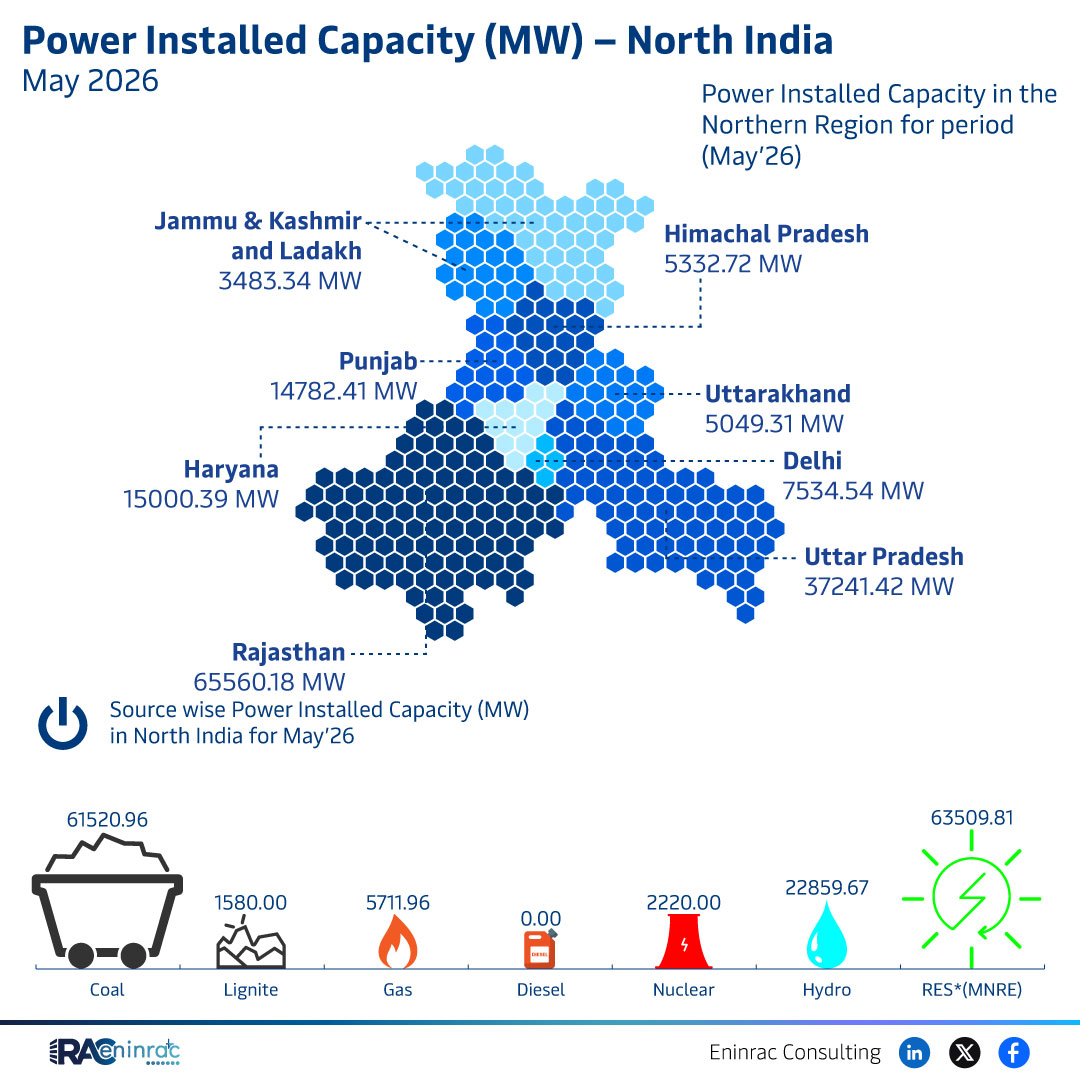
In May 2026 the northern region of India reported a comprehensive snapshot of power installed capacity across its states. Understanding this data is essential for investors, policymakers, and industry analysts who track energy trends, regional growth, and the balance between conventional and renewable sources. This article breaks down the figures, highlights key insights, and explains the implications for the energy sector.
What Does the Data Reveal About This Topic?
The raw numbers show that Rajasthan leads with 65,560.18 MW, followed by Uttar Pradesh at 37,241.42 MW and Haryana at 15,000.39 MW. Smaller states such as Jammu & Kashmir, Himachal Pradesh and Ladakh together contribute only 3,483.34 MW. The source‑wise breakdown indicates a heavy reliance on coal, lignite, gas and diesel, while renewable sources like hydro, solar and wind remain a modest share of the total capacity.
Regional Capacity Comparison
When comparing states, Rajasthan’s capacity is nearly double that of Uttar Pradesh and more than three times the combined capacity of the three Himalayan states. Delhi’s 7,534.54 MW reflects its urban demand, whereas Uttarakhand’s 5,049.31 MW underscores limited infrastructure in mountainous terrain. The data also suggests that states with larger industrial bases tend to have higher installed capacity, pointing to a correlation between economic activity and power infrastructure.
Impact on Sectors and Industries
The distribution of installed capacity influences several sectors. Heavy industries and manufacturing clusters in Rajasthan and Haryana benefit from reliable power, attracting further investment. Conversely, regions with lower capacity may face constraints on industrial expansion and face higher electricity costs. The dominance of fossil‑fuel‑based generation raises concerns for environmental regulators and investors focused on clean energy transitions, prompting policy discussions on accelerating renewable integration.
Key Takeaways
- Rajasthan holds the highest installed capacity in North India at 65,560.18 MW.
- Uttar Pradesh and Haryana rank second and third, highlighting industrial power demand.
- Himalayan states contribute less than 5,000 MW collectively, indicating infrastructure gaps.
- Fossil fuels dominate the generation mix, with renewable sources representing a small fraction.
- Higher capacity correlates with stronger industrial and economic activity.
- Policymakers must address the renewable shortfall to meet climate goals.
FAQs
Which state has the largest power installed capacity in North India?
Rajasthan leads with 65,560.18 MW of installed capacity.
How does renewable energy compare to fossil fuels in the region?
Renewable sources such as hydro, solar and wind account for a modest share, while coal, lignite, gas and diesel dominate the mix.
Why is Uttar Pradesh’s capacity significant?
At 37,241.42 MW, Uttar Pradesh’s capacity supports its large population and growing industrial sector.
What challenges do Himalayan states face?
Limited infrastructure and difficult terrain result in low installed capacity, hindering economic development.
What are the implications for investors?
Investors should note the concentration of capacity in a few states and the need for renewable projects to balance the energy portfolio.