
Introduction
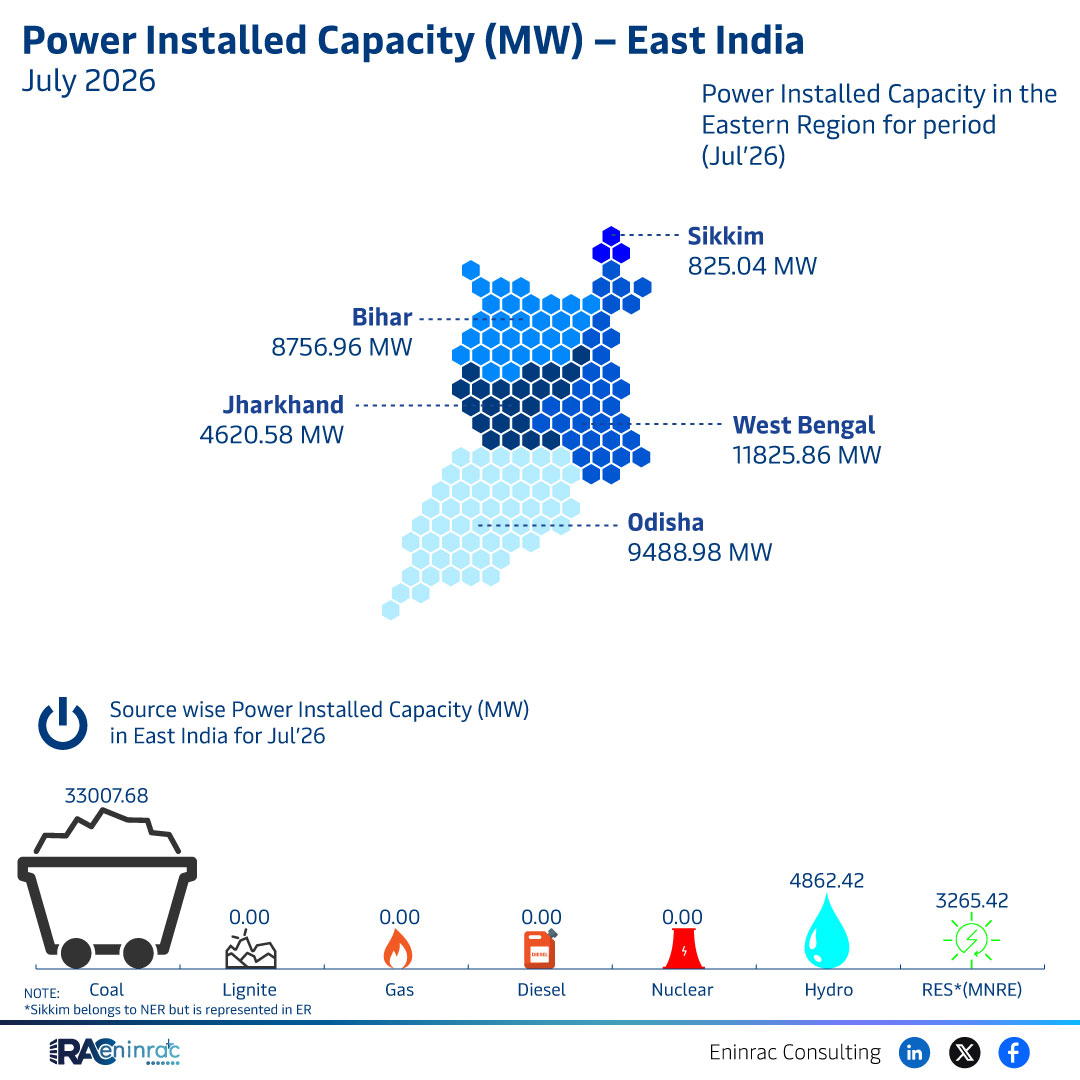
July 2026 brings the latest snapshot of East India power installed capacity, revealing how each state contributes to the region’s overall energy landscape. Understanding the distribution of installed capacity helps policymakers, investors, and industry analysts gauge growth, identify gaps, and plan for future demand. In this article, readers will learn the total capacity, statewise breakdowns, source mix, and the implications for both conventional and renewable energy sectors.
What Does the Data Reveal About This Topic?
The data shows that East India power installed capacity reached 33,007.68 MW in July 2026, with West Bengal leading at 11,825.86 MW followed closely by Odisha at 9,488.98 MW. Bihar contributed 8,756.96 MW, while Sikkim added 825.04 MW. Although the figure for Jharkhand is unclear due to garbled text, the overall picture highlights a strong reliance on conventional sources with emerging renewable contributions across the region.
Statewise Power Installed Capacity Comparison
When comparing the states, West Bengal stands out as the dominant power producer, accounting for roughly 36% of the regional total. Odisha follows with about 27%, and Bihar supplies nearly 27% as well. Sikkim’s modest 825 MW reflects its smaller geographic size but underscores its inclusion in the broader East India analysis despite belonging to the North‑Eastern region. The missing Jharkhand figure suggests a need for data verification, yet the trend points to a concentration of capacity in a few key states.
Impact on Sectors and Industries
The magnitude of East India power installed capacity influences multiple sectors. Energy investors can target high‑growth states such as West Bengal and Odisha for new projects, while policymakers must balance the conventional coal and gas mix with expanding renewable sources like hydro and solar. Utilities benefit from knowing capacity hotspots to plan grid upgrades, and industry players can align supply chains for equipment and services accordingly. The data also signals opportunities for renewable energy integration, especially in states with lower existing capacity.
Key Takeaways
- Total installed capacity in East India reached 33,007.68 MW.
- West Bengal leads with 11,825.86 MW, the highest among states.
- Odisha and Bihar together contribute over 18,000 MW.
- Sikkim’s 825.04 MW reflects its smaller scale yet strategic importance.
- Data gaps for Jharkhand highlight the need for clearer reporting.
- Conventional sources dominate, but renewable potential remains significant.
FAQs
What was the total power installed capacity in East India for July 2026?
The region’s total installed capacity was 33,007.68 MW.
Which state had the highest installed capacity?
West Bengal topped the list with 11,825.86 MW.
How does Bihar’s capacity compare to Odisha’s?
Bihar provided 8,756.96 MW while Odisha supplied 9,488.98 MW, making Odisha slightly higher.
What renewable sources are included in the East India mix?
The data references hydro and other RES (Renewable Energy Sources) under MNRE, indicating a growing renewable share.
Why is Jharkhand’s capacity figure unclear?
The source text contains garbled characters for Jharkhand, suggesting a reporting error that needs clarification.