
Introduction
The June 2026 peak power demand figures for East India provide a critical snapshot of regional electricity consumption during a high‑load period. Understanding which states draw the most power, how close the grid came to its capacity, and what the implications are for planners helps stakeholders gauge grid reliability, investment needs, and policy direction. This article breaks down the raw numbers, compares state performances, and outlines the broader impact on energy markets.
What Does the Data Reveal About This Topic?
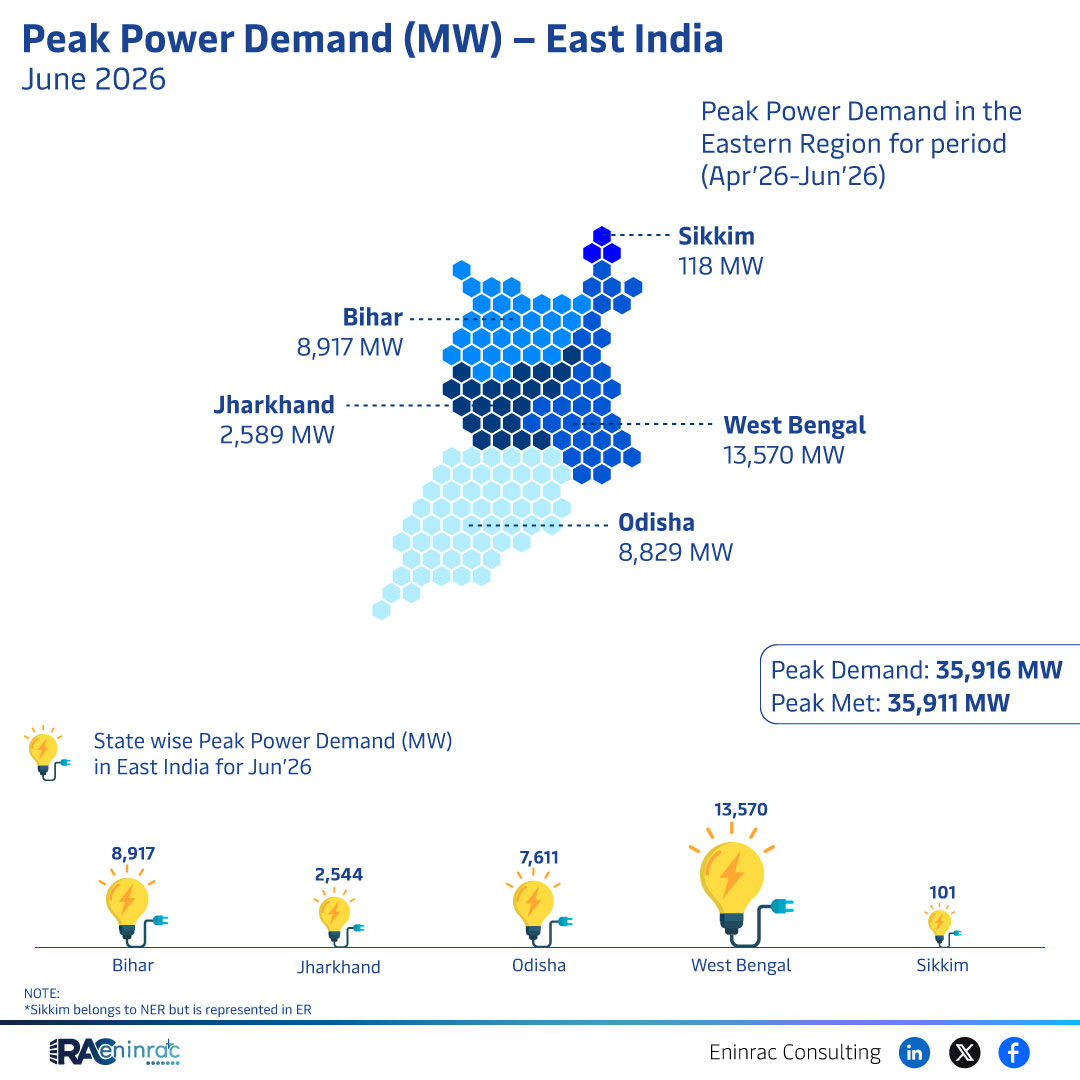
Which states in East India contributed most to the June 2026 peak load, and how did the supply match demand? The data shows West Bengal topped the list with a peak of 13,570 MW, followed by Bihar at 8,917 MW. Jharkhand and Odisha each recorded demand around 2,500 MW, while Sikkim’s contribution was minimal at 18 MW. The aggregate peak demand reached 35,916 MW, and the grid met 35,911 MW, leaving a marginal shortfall of just 5 MW.
Statewise Comparison of June 2026 Peak Demand
Analyzing the figures reveals clear hierarchies among the states. West Bengal’s demand eclipses the next highest state by nearly 4,600 MW, underscoring its industrial base and dense population. Bihar, with its expanding manufacturing sector, holds the second position and contributes roughly 25 % of the total East India load. Jharkhand and Odisha, rich in mining and power‑intensive activities, each account for about 7 % of the region’s peak demand. Sikkim, classified under the North‑East Region but listed here, registers a negligible demand, reflecting its small economy and reliance on hydro‑electric sources. The near‑perfect match between peak demand and met capacity illustrates the effectiveness of grid management during peak periods.
Impact on Sectors and Industries
These demand patterns influence multiple sectors. Utilities use the data to fine‑tune generation schedules, allocate reserve capacity, and plan upgrades to transmission infrastructure. Investors assess the high demand in West Bengal and Bihar as signals for potential new thermal or renewable projects, while the modest demand in Jharkhand and Odisha may attract niche investments in mining‑related power solutions. Policymakers can justify incentives for demand‑side management in the highest‑consumption states to alleviate stress on the grid. Consumers, especially industrial users, benefit from improved reliability and reduced outage risk when the system operates close to but not beyond its capacity.
Key Takeaways
- West Bengal recorded the highest June 2026 peak demand at 13,570 MW.
- Bihar contributed the second‑largest demand with 8,917 MW.
- Jharkhand and Odisha each hovered around 2,500 MW, showing balanced industrial consumption.
- Sikkim’s demand was minimal at 18 MW, highlighting regional disparities.
- Total East India peak demand reached 35,916 MW, with supply meeting 35,911 MW.
- The 5 MW shortfall indicates a well‑managed grid but underscores the need for marginal capacity buffers.
FAQs
What was the total peak power demand in East India for June 2026?
The region recorded a total peak demand of 35,916 MW.
Which state had the highest electricity demand during this period?
West Bengal topped the list with a peak demand of 13,570 MW.
How close was the supply to the peak demand?
The grid met 35,911 MW of the 35,916 MW demand, leaving a shortfall of only 5 MW.
Why is Sikkim’s demand so low compared to other East Indian states?
Sikkim’s small population and reliance on hydro‑electric power result in minimal peak demand, recorded at 18 MW.
What implications do these figures have for future energy investments?
High demand in West Bengal and Bihar signals opportunities for new generation and transmission projects, while the near‑balanced supply‑demand ratio encourages focus on grid resilience and demand‑side management.