
Introduction
The June 2026 snapshot of West India energy power requirement provides a concise view of how six key states are balancing demand and supply. Understanding these numbers is crucial for policymakers, investors, and industry leaders who need to anticipate short‑term gaps, plan infrastructure upgrades, and align with national energy goals. This article breaks down the raw figures, highlights regional disparities, and explains what the data means for the wider power sector.
What Does the Data Reveal About This Topic?
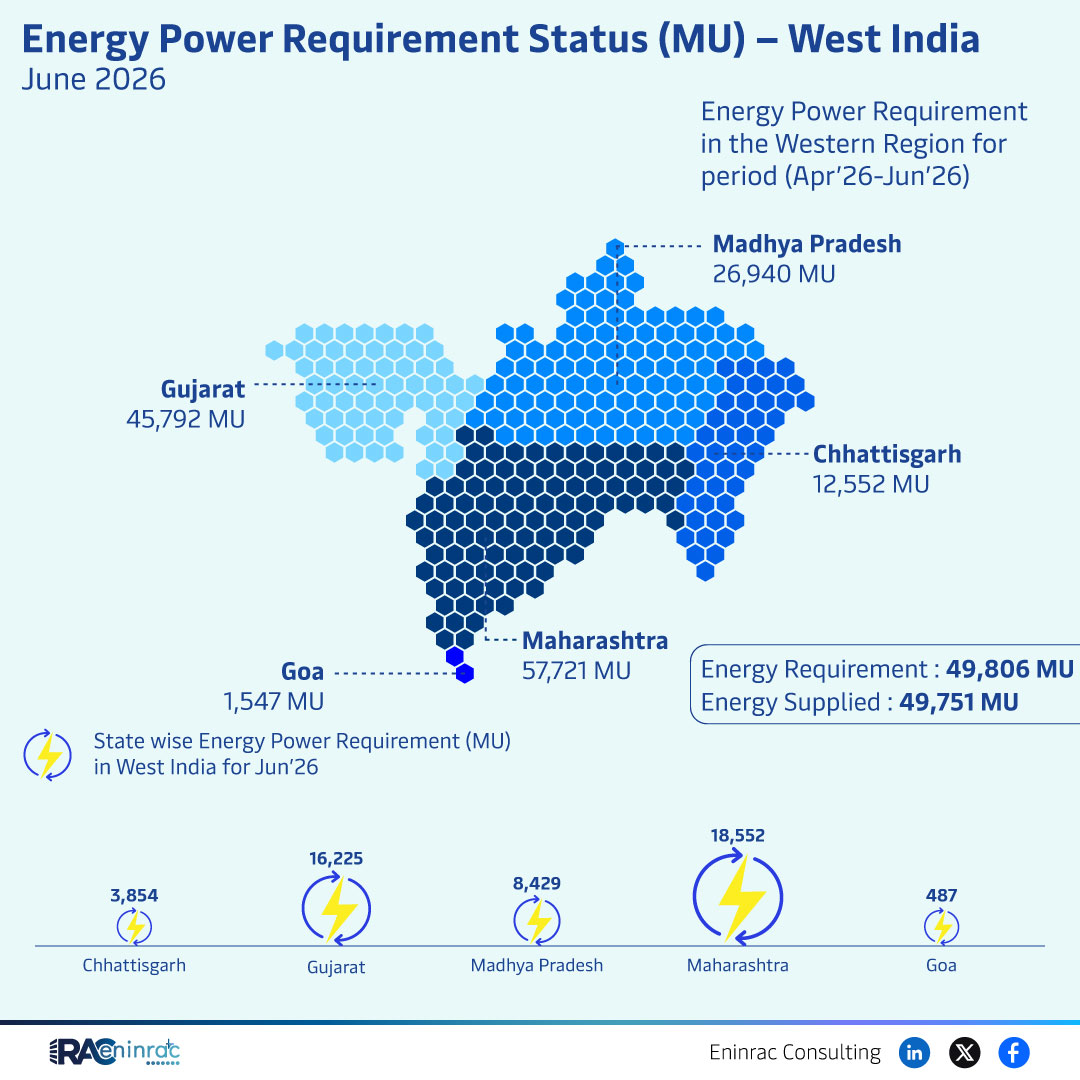
Why does the June 2026 data matter? It shows that the combined energy power requirement for the Western Region stands at 26,940 MU, while actual supply reaches 49,751 MU, indicating a substantial oversupply for the period in question. The figures also expose which states are the largest consumers and which have the most balanced demand‑supply relationship, offering a clear picture of regional pressure points.
Statewise Energy Demand Comparison in West India
When we examine the statewise breakdown, Gujarat emerges as the top consumer with 45,792 MU, followed by Maharashtra at 57,721 MU, Chhattisgarh at 12,552 MU, and a smaller contribution from Goa. Madhya Pradesh is listed but without a specific figure, suggesting either negligible demand or a reporting omission. The data also notes an overall energy requirement of 49,806 MU and a supplied amount of 49,751 MU, showing a marginal shortfall of 55 MU that is statistically insignificant but worth monitoring for future supply‑security planning.
Impact on Sectors and Industries
The power requirement profile directly influences several sectors. Heavy‑industry users in Gujarat and Maharashtra may face tighter margins if demand spikes, prompting investments in backup generation or demand‑response programs. Renewable‑energy developers can target these high‑demand states for new solar or wind projects to reduce dependence on conventional sources. Financial investors use such statewise data to assess risk, allocate capital, and forecast returns on power‑generation assets. Policymakers, meanwhile, can fine‑tune tariff structures and incentivize efficiency measures where the demand‑supply gap is most pronounced.
Key Takeaways
- Gujarat and Maharashtra dominate the West India energy power requirement, together accounting for over 100,000 MU of demand.
- The overall region shows a slight oversupply, with supplied MU marginally lower than the reported requirement.
- Chhattisgarh's demand remains modest, highlighting potential for growth or targeted renewable projects.
- Goa’s contribution is minimal, suggesting limited industrial load or strong efficiency measures.
- The data underscores the importance of accurate statewise reporting for effective grid management.
- Investors should prioritize high‑demand states for new generation capacity and consider demand‑side management solutions.
FAQs
What is the total energy power requirement for West India in June 2026?
The total requirement is reported as 26,940 MU for the Western Region, with an overall energy requirement of 49,806 MU when state totals are summed.
Which state has the highest energy demand?
Gujarat records the highest demand at 45,792 MU, closely followed by Maharashtra at 57,721 MU.
Is there a supply deficit in June 2026?
The data shows a marginal shortfall of 55 MU (49,751 MU supplied vs. 49,806 MU required), which is statistically negligible.
How can investors use this data?
Investors can identify high‑demand states for new power projects, assess risk, and allocate capital toward renewable or conventional generation where demand outpaces supply.
What role do policymakers play based on this data?
Policymakers can adjust tariffs, promote efficiency programs, and target infrastructure investments to balance demand and supply in states with the greatest pressure.