
Introduction
The latest intra‑state PNG (Piped Natural Gas) connections data for India, released for July 2026, provides a granular view of how natural gas infrastructure is spreading across the nation’s states and regions. With over six hundred thousand connections recorded, the dataset captures the scale of conventional energy development at a sub‑national level. Understanding this distribution is crucial for investors, policymakers, and energy companies that are planning new pipelines, CNG stations, and related projects. In this article we break down the numbers, compare regional performance, and discuss the broader implications for India’s energy transition and market dynamics.
What Does the Data Reveal About This Topic?
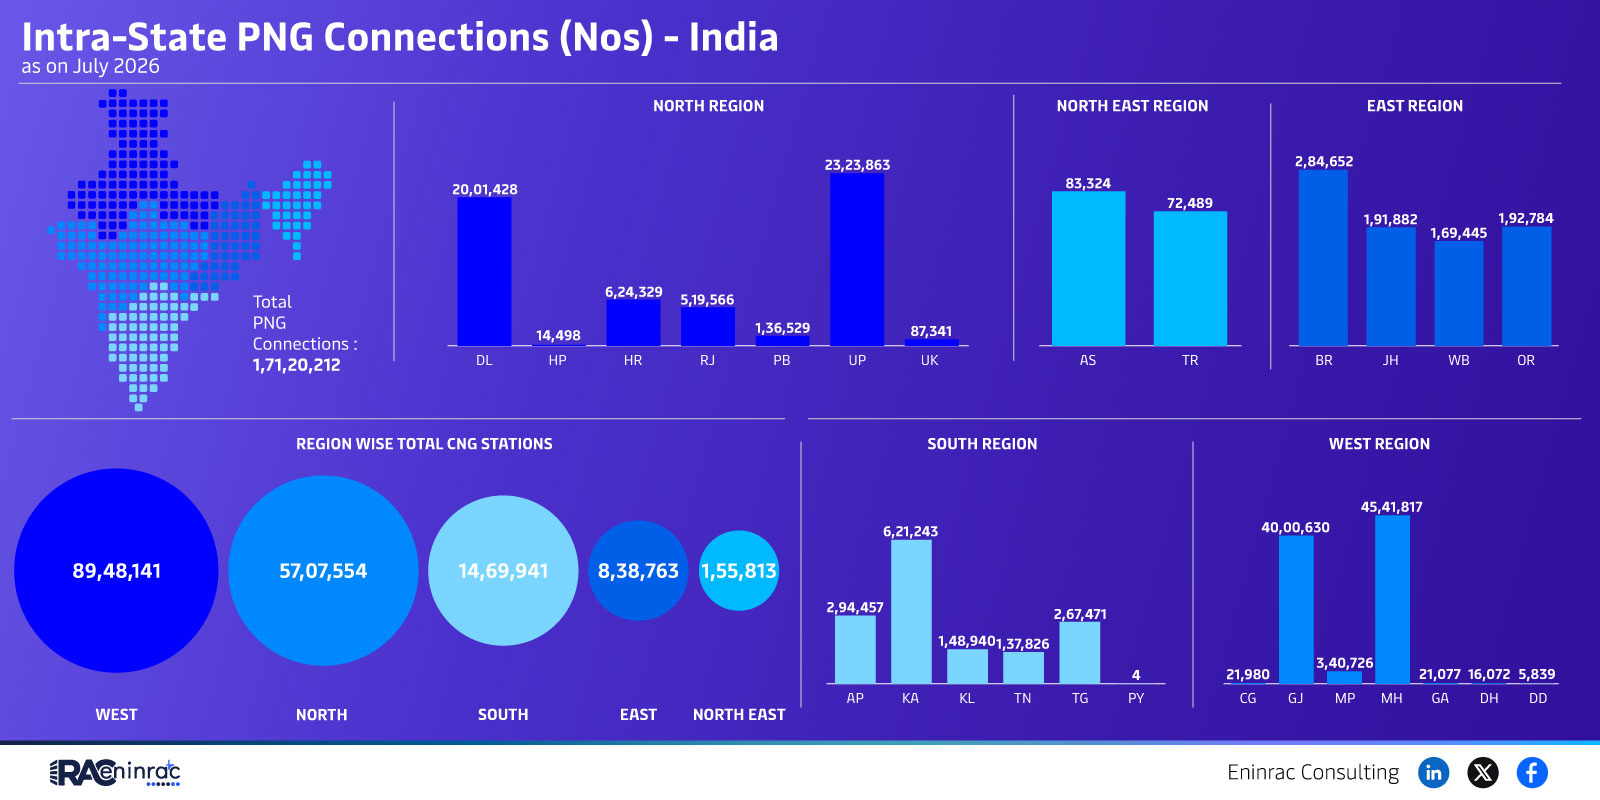
What does the raw data actually tell us about intra‑state PNG connectivity? The figures show that the North and West regions together account for more than half of all connections, while the Northeast and East regions lag behind with relatively modest numbers. Specifically, the North region records 23,23,863 connections, the West 45,41,817, whereas the Northeast contributes just 2,84,652 and the East 20,01,428 connections. These disparities highlight uneven infrastructure rollout and point to future investment opportunities in under‑served areas.
Regional Distribution of PNG Connections Across India
A comparative look at the regional totals reveals that the West region leads with 45,41,817 intra‑state PNG connections, followed closely by the North with 23,23,863. The South adds 4,91,882 connections, while the East and Northeast register 20,01,428 and 2,84,652 respectively. When PNG figures are combined with CNG station counts, the West still dominates with 89,48,141 total stations, underscoring its role as a hub for conventional energy infrastructure. The data also shows that smaller regions such as the Northeast have relatively low CNG presence, indicating potential gaps in last‑mile distribution that could be addressed through targeted policy and private investment.
Impact on Sectors and Industries
The distribution of intra‑state PNG connections influences several key sectors. Energy utilities can prioritize pipeline extensions to high‑growth corridors, while construction firms see increased demand for pipe laying and station development. Financial investors gain a clear map of where capital deployment may yield higher returns, especially in underserved regions. Policymakers can use the data to design incentives that encourage balanced growth, reducing regional disparities and supporting the broader goal of energy security. Additionally, consumer markets in regions with dense PNG networks benefit from lower fuel costs for transportation and industry.
Key Takeaways
- The West and North regions together hold more than 60% of India’s intra‑state PNG connections.
- East and Northeast regions lag significantly, indicating untapped market potential.
- CNG stations are heavily concentrated in the West, reinforcing its status as an energy hub.
- Regional imbalances suggest a need for targeted investment and policy support.
- Investors can identify growth zones by focusing on under‑served states.
- Improved PNG connectivity can enhance energy security and lower costs for end users.
FAQs
Which Indian region has the most intra‑state PNG connections?
The West region leads with 45,41,817 connections as of July 2026.
How many PNG connections are recorded in the North region?
The North region records 23,23,863 intra‑state PNG connections.
Why are the Northeast and East regions important for future investment?
Both regions have relatively low connection counts, indicating significant growth potential for new pipelines and CNG stations.
What is the total number of CNG stations in the West region?
The West region hosts 89,48,141 CNG stations, the highest among all regions.
How does this data affect energy policy in India?
Policymakers can use the regional breakdown to allocate resources, design incentives, and reduce disparities in natural gas access.