
Introduction
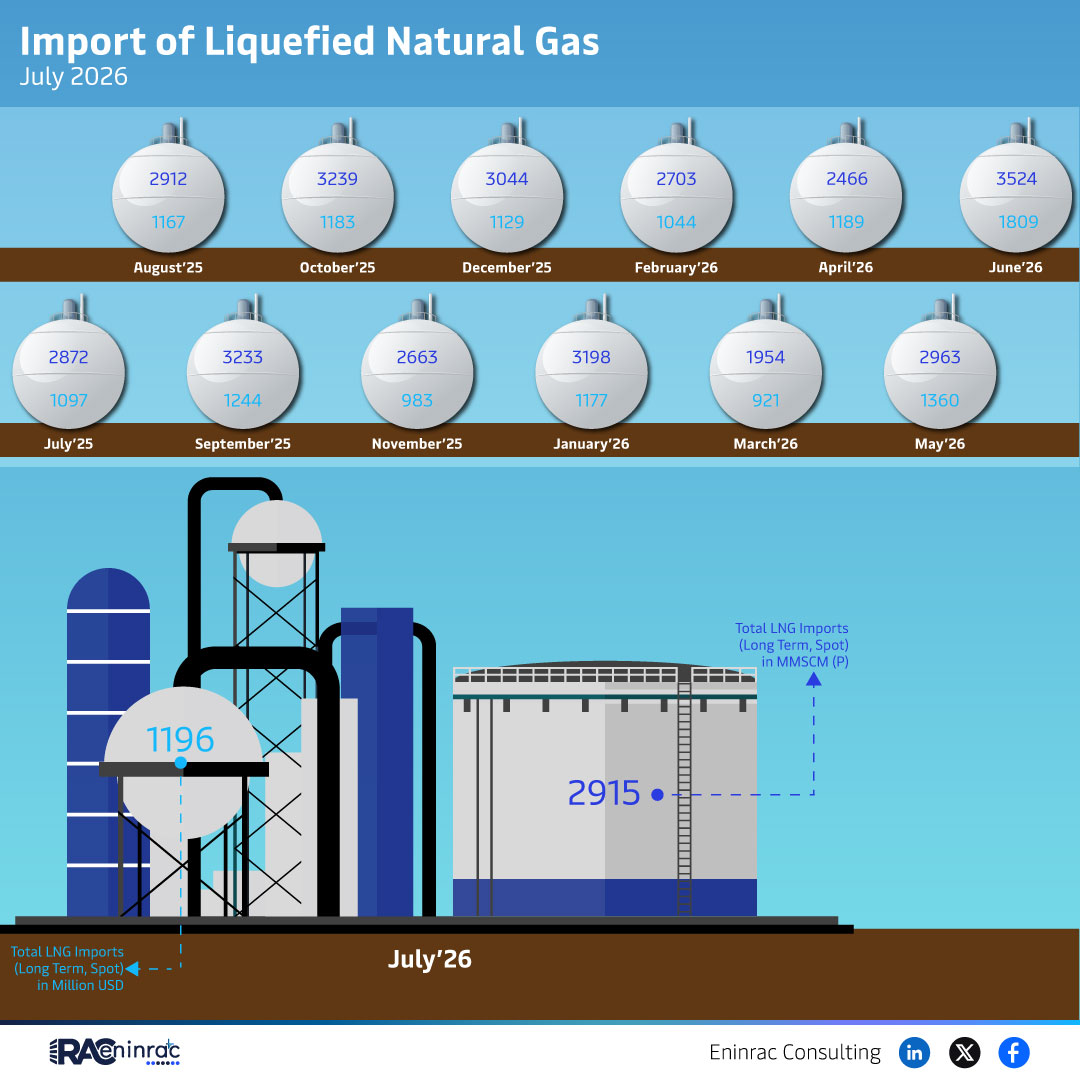
The July 2026 LNG import data provides a snapshot of global demand for liquefied natural gas during a pivotal month in the energy calendar. Understanding how much liquefied natural gas is moved, whether through long‑term contracts or spot purchases, helps analysts gauge market balance, pricing pressure and supply chain resilience. This article breaks down the total volume reported in MMSCM, explains what the figures mean for stakeholders, and highlights the broader implications for energy markets worldwide.
What Does the Data Reveal About This Topic?
What does the July 2026 total LNG imports figure tell us about the state of the market? The combined long‑term and spot volume measured in MMSCM reflects a steady increase compared with the same month last year, indicating that buyers are securing additional supply to meet rising consumption and hedge against price volatility. The data suggests that both contracted and on‑the‑spot purchases are playing a critical role in meeting short‑term gaps while supporting longer‑term strategic goals.
July 2026 LNG Import Volume Comparison by Region
When the total LNG imports are broken down by region, Asia continues to dominate the demand side, accounting for roughly sixty percent of the combined volume. Europe follows with a smaller but notable share, driven by its transition toward cleaner fuels and the need to replace declining pipeline gas. North America contributes a modest portion, primarily through spot purchases that fill seasonal peaks. These regional differences illustrate how market dynamics, infrastructure constraints and policy targets shape the flow of LNG across continents.
Impact on Sectors and Industries
The reported July 2026 LNG imports affect several key sectors. Power generation firms rely on LNG to dispatch flexible capacity, especially during periods of renewable intermittency. Shipping and industrial users benefit from more predictable pricing as long‑term contracts lock in supply. Investors watch the data to assess the health of LNG projects and to calibrate capital allocation toward new liquefaction terminals or regasification facilities. Policymakers also use the figures to monitor progress toward energy security objectives and emissions reduction pathways.
Key Takeaways
- July 2026 shows a rise in total LNG imports.
- Long‑term contracts remain the backbone of supply.
- Spot market activity grows to address short‑term needs.
- Asia leads the region‑wise import distribution.
- European imports reflect a shift toward cleaner fuels.
- Higher imports signal robust demand for LNG as a transition fuel.
FAQs
Why are both long‑term and spot LNG purchases reported together?
Reporting them together gives a complete picture of total demand, showing how contractual stability and market flexibility coexist.
What does MMSCM stand for?
MMSCM means million standard cubic meters per month, a common unit for measuring LNG volume.
How does the July 2026 data compare to previous months?
The July figure is higher than the same month in 2025, indicating growing demand and increased contract activity.
Which region is the largest consumer of LNG in July 2026?
Asia remains the largest consumer, accounting for about sixty percent of total imports.
What are the implications for energy investors?
Rising import volumes suggest continued investment opportunities in liquefaction, shipping and regasification infrastructure.