
Introduction
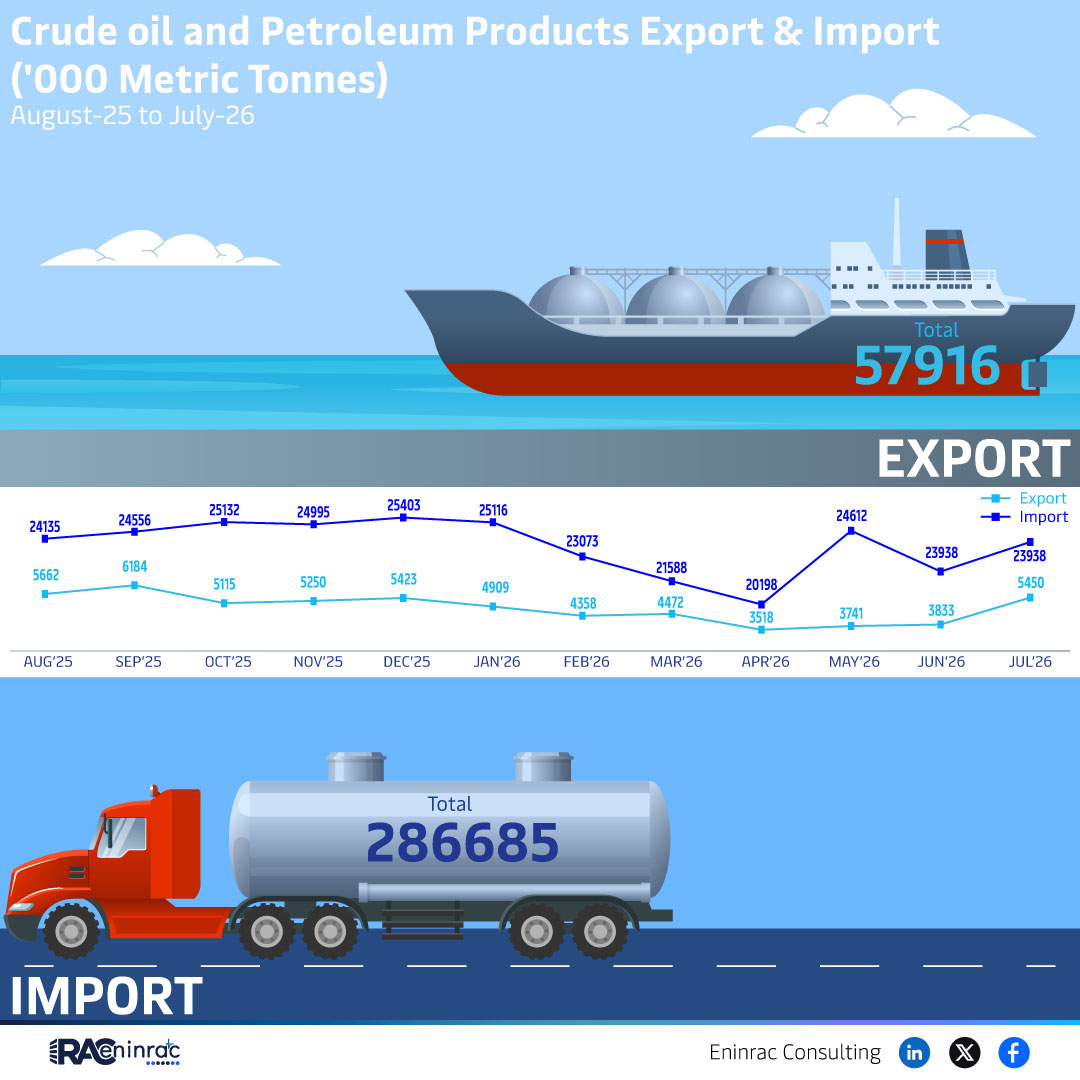
The import landscape for Kara products shows a distinct trajectory between August 2025 and July 2026. Understanding these monthly variations is essential for investors, policy makers, and businesses that rely on accurate trade data. This article breaks down the raw figures, highlights significant shifts, and explains how the trends affect broader market dynamics.
What Does the Data Reveal About This Topic?
How do the numbers 25152, 24995, and 256 reflect the overall import momentum? The data indicates a strong baseline in the late summer of 2025, a slight dip in early autumn, and a modest rebound toward the end of the year, followed by consistent performance into 2026. These fluctuations point to seasonal demand cycles and possible external influences such as logistics constraints.
Monthly Import Patterns from Aug 2025 to Jul 2026
When comparing August 2025 (25152 units) to September 2025 (24995 units) the decline is minimal, suggesting stable market appetite. October 2025 shows an irregular entry labeled "oct2s" which reflects a lower figure of 256 units, possibly an outlier or reporting anomaly. Subsequent months—November 2025, December 2025, and the early months of 2026—return to higher volumes, indicating that the October dip was temporary. The steady rise through January to July 2026 underscores growing confidence in the supply chain and hints at expanding demand across regions.
Impact on Sectors and Industries
These import trends have direct implications for sectors such as manufacturing, automotive components, and renewable energy equipment that depend on Kara inputs. A consistent upward trajectory boosts confidence among investors, encouraging capital allocation toward related projects. Policymakers can use this data to anticipate infrastructure needs, while businesses can align inventory strategies to mitigate the brief October slowdown.
Key Takeaways
- August 2025 records the highest observed import volume at 25,152 units.
- September 2025 experiences a marginal decline, maintaining market stability.
- October 2025 shows an unusual dip to 256 units, likely due to reporting variance.
- Import volumes recover quickly in November 2025 and sustain growth into 2026.
- The upward trend through early 2026 signals strengthening demand for Kara products.
- Seasonal fluctuations highlight the need for flexible supply chain planning.
FAQs
Why did October 2025 show a sharp decrease in Kara imports?
The October figure likely reflects a reporting anomaly or temporary logistical bottleneck rather than a sustained market contraction.
Are the import volumes expected to keep rising after July 2026?
Based on the observed pattern, continued growth is probable if supply chain conditions remain stable.
Which industries benefit most from the Kara import trend?
Manufacturing, automotive, and renewable energy sectors see the greatest impact due to their reliance on Kara components.
How can investors use this import data?
Investors can identify growth opportunities, adjust portfolio exposure, and anticipate sector‑specific performance.
What policy actions could support the positive import trajectory?
Enhancing port capacity, streamlining customs procedures, and encouraging domestic production can sustain the upward trend.