Introduction
The fiscal year 2025-26 marks a pivotal period for liquefied natural gas (LNG) imports, with quarterly volumes showing notable fluctuations. Understanding these trends is essential for investors, policymakers, and industry stakeholders who rely on LNG to balance energy demand, price stability, and supply security. This article breaks down the raw import figures, highlights key patterns, and explains the broader implications for the energy market.
What Does the Data Reveal About This Topic?
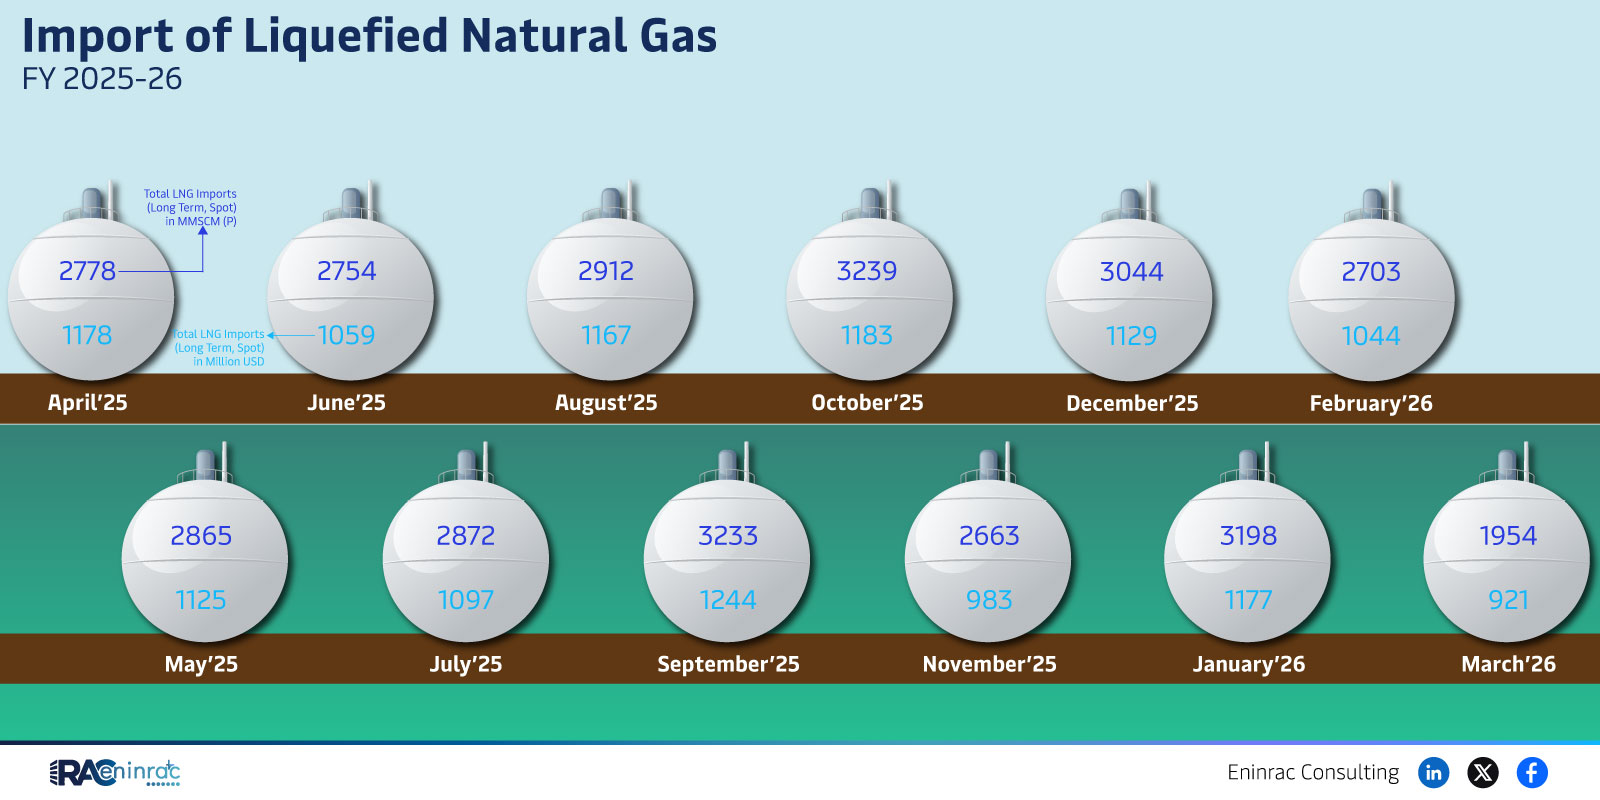
What insight does the raw data provide? The numbers—2778, 2754, 2912, 3239, 3044, and 2703—represent monthly import volumes (in thousand metric tons) across six reporting periods from June 2025 to February 2026. The data shows a peak in the fourth period (3239) followed by a gradual decline, indicating seasonal demand shifts and possible supply constraints.
Seasonal Peaks and Declines in LNG Imports
Comparing the six periods, the fourth quarter experiences the highest import level at 3,239 thousand metric tons, likely driven by winter heating demand in the northern hemisphere. The subsequent drop to 2,703 thousand metric tons in the final period suggests a transition to lower seasonal demand and possibly the impact of alternative energy sources coming online. Regions with colder climates typically increase LNG imports during winter, while warmer months see reduced volumes.
Impact on Sectors and Industries
LNG import trends directly affect power generation, heavy industry, and transportation sectors that depend on natural gas for fuel and feedstock. Higher import volumes can support electricity generation during peak load periods, reduce reliance on coal, and help meet emissions targets. Conversely, a decline may pressure domestic producers to fill gaps, influencing pricing and investment decisions across the conventional energy landscape.
Key Takeaways
- Import volumes peaked at 3,239 thousand metric tons in the fourth reporting period.
- Seasonal demand drives higher LNG imports during colder months.
- Overall volume decreased to 2,703 thousand metric tons by February 2026.
- Fluctuations influence power generation costs and emissions strategies.
- Investors should monitor supply contracts and regional demand shifts.
- Policymakers can use these trends to plan infrastructure and diversification.
FAQs
Why did LNG imports peak in the fourth period?
The peak aligns with winter heating demand, prompting utilities to secure additional LNG to ensure reliable power supply.
What causes the decline after the peak?
Warmer weather reduces heating needs, and alternative energy sources may offset LNG demand, leading to lower imports.
How do import trends affect natural gas prices?
Higher import volumes can stabilize prices by meeting demand, while declines may tighten supply and push prices upward.
Which regions are most sensitive to these import changes?
Countries with limited domestic gas production and high winter heating requirements are most affected.
What should investors watch for in future LNG import data?
Watch for contract renewals, new supply routes, and policy shifts toward renewable integration that could alter import volumes.