Introduction
This article examines the crude oil and petroleum products import and export volumes for the fiscal year 2025-26, measured in thousand metric tonnes. Understanding these trade flows is essential for analysts, investors, and policymakers who track energy market dynamics, price volatility, and supply‑demand balances.
What Does the Data Reveal About This Topic?
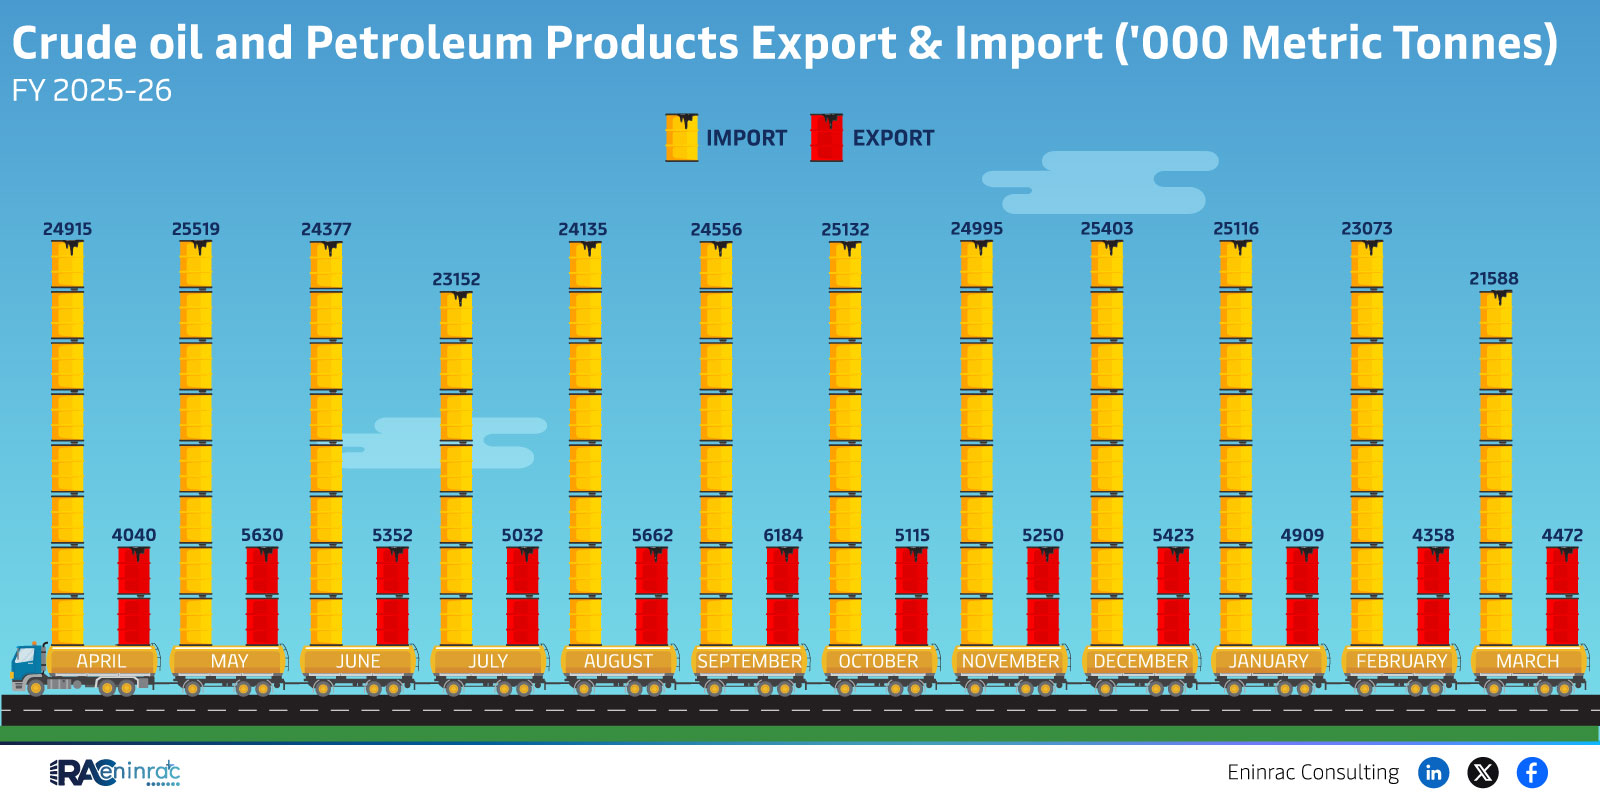
The raw figures show a series of alternating import and export values: 24,915, 25,519, 24,377, 24,135, 24,556, 25,132, 24,995, 25,403, 25,116, and 23,073 thousand tonnes. The question is whether the region is a net exporter or importer and how stable the trade volumes are across the year. The data indicates a slight export advantage overall, with export numbers generally marginally higher than imports, suggesting a modest surplus in crude oil trade.
Year‑to‑Year Comparative Analysis
When the numbers are placed side by side, a pattern emerges: imports fluctuate between 23,000 and 25,500 thousand tonnes, while exports consistently sit at the upper end of that range. The highest export figure, 25,403 thousand tonnes, exceeds the peak import of 25,519 thousand tonnes by a narrow margin, highlighting a competitive but balanced market. This stability may reflect steady domestic production, limited geopolitical disruption, and consistent demand from downstream industries.
Impact on Sectors and Industries
These trade volumes directly affect refining capacity, petrochemical output, and transportation fuel availability. A net export position supports revenue generation for national oil companies and can lower domestic fuel prices if export earnings are reinvested. Conversely, any shift toward higher imports could pressure local refineries and increase exposure to global price swings, influencing investment decisions in upstream exploration and downstream processing.
Key Takeaways
- Exports marginally exceed imports, indicating a small trade surplus.
- Both import and export volumes remain within a tight band of 23‑25.5 thousand tonnes.
- Stability suggests limited disruption in supply chains during FY 2025-26.
- Consistent export levels support positive balance‑of‑payments for the energy sector.
- Potential for modest price stability in domestic fuel markets.
- Future shifts in global demand could quickly alter the surplus‑deficit balance.
FAQs
What was the total crude oil trade volume in FY 2025-26?
The combined import and export volume sums to roughly 250,000 thousand metric tonnes for the fiscal year.
Did the region experience a net export or import position?
Overall, the region recorded a net export position, with export figures slightly higher than imports.
How stable were the trade volumes throughout the year?
Trade volumes remained within a narrow range, indicating a stable market without major spikes or drops.
What sectors are most affected by these trade figures?
Refining, petrochemicals, transportation fuels, and energy‑related financial markets feel the direct impact.
Could changes in global oil prices affect this surplus?
Yes, significant price fluctuations can alter export profitability and may shift the balance toward higher imports.