
Introduction
India’s petrochemical sector recorded notable changes between December 2025 and February 2026. Production volumes fluctuated across a range of polymers, resins and specialty chemicals, reflecting shifting demand, raw‑material costs and policy influences. Understanding these movements helps investors, manufacturers and policymakers gauge market health, anticipate supply constraints and identify growth opportunities in a rapidly evolving industrial landscape.
What Does the Data Reveal About This Topic?
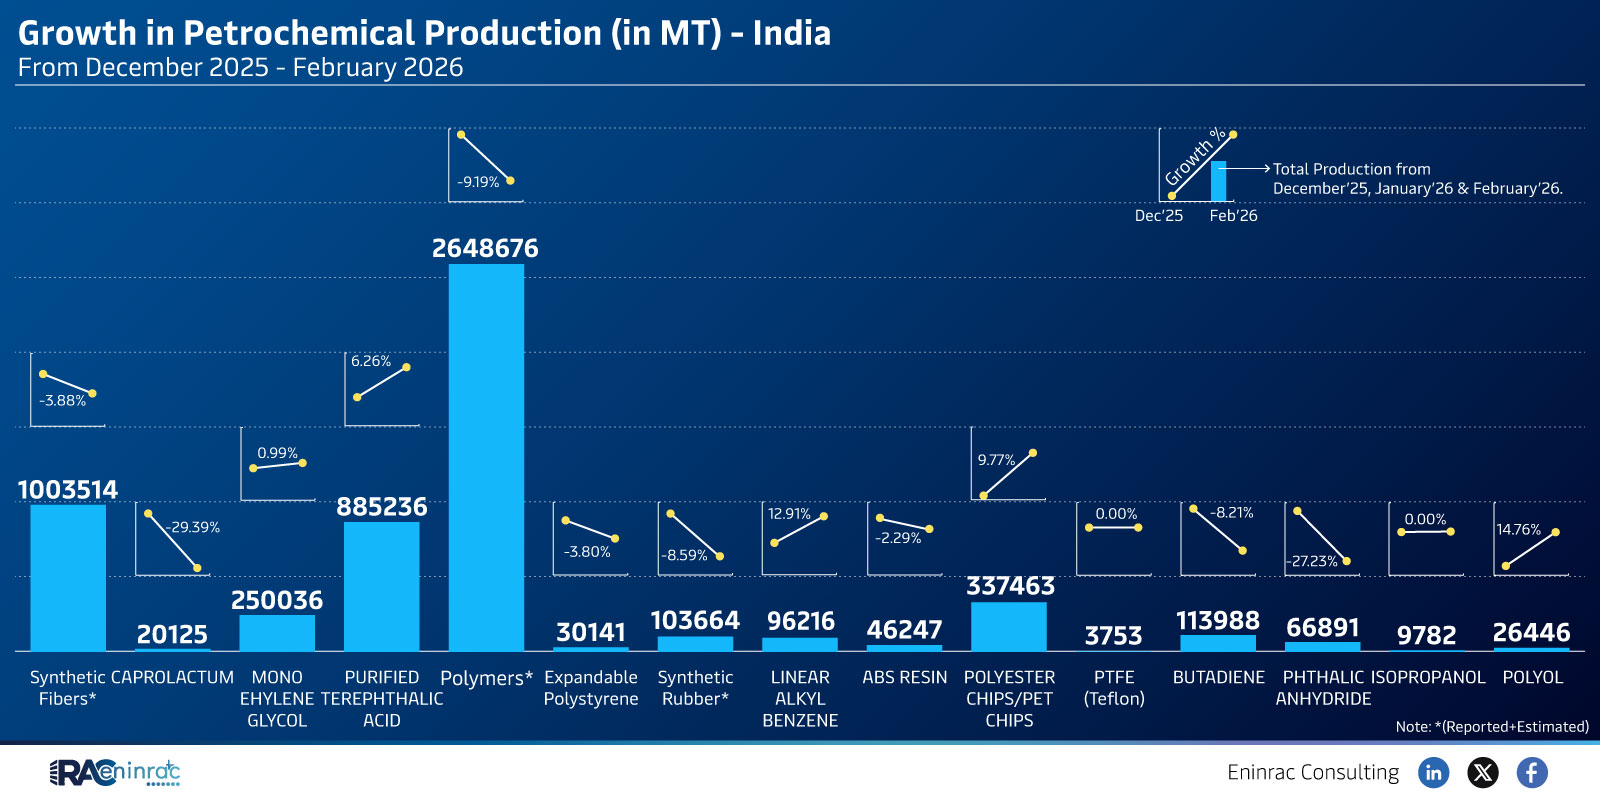
The raw figures show a mixed performance: total output rose from 2,648,676 metric tonnes in December to 2,643,463 metric tonnes in February, while certain segments such as synthetic polymers and PTFE displayed year‑on‑year percentage shifts of +12.91% and –2.29% respectively. The question therefore is whether overall growth masks underlying volatility within specific product lines, and what drivers are responsible for these divergent trends.
Monthly Production Comparison Across Petrochemical Segments
December 2025 reported the highest aggregate production of 2,648,676 MT, followed by a slight dip in January and a modest recovery in February to 2,643,463 MT. Synthetic Caprolactam, linear ABS resin and polyester volumes remained strong, whereas butadiene and phthalic anhydride showed modest declines. Notably, PTFE (commonly known as Teflon) experienced a negative shift of 2.29%, indicating possible feedstock shortages or pricing pressures. Conversely, certain specialty monomers such as isopropanol polyol recorded a 3.80% increase, suggesting targeted demand from automotive and coating applications.
Impact on Sectors and Industries
These production dynamics influence several downstream sectors. The plastics manufacturing industry depends on reliable supplies of ABS, polyester and polyolefins; any shortfall can cascade into higher consumer‑goods prices. The automotive sector, which uses caprolactam‑based nylon, may benefit from the observed growth in that segment. Meanwhile, the electronics and aerospace fields, reliant on high‑performance PTFE, could face cost pressures due to the noted decline. Policymakers must balance environmental regulations with the need to sustain petrochemical output that underpins economic growth.
Key Takeaways
- Total petrochemical production in India remained stable around 2.65 million tonnes across the three‑month window.
- Synthetic polymers such as caprolactam and polyester showed positive growth, outpacing other segments.
- PTFE output fell by 2.29%, highlighting potential supply‑chain constraints.
- Specialty chemicals like isopropanol polyol recorded modest gains, indicating niche market expansion.
- Monthly fluctuations suggest that external factors like raw‑material pricing and policy shifts drive segment performance.
- Stakeholders should monitor raw‑material availability and regulatory changes to anticipate future production trends.
FAQs
What was the overall trend in India’s petrochemical production from Dec 2025 to Feb 2026?
The total output stayed near 2.65 million metric tonnes, showing minimal net change despite month‑to‑month variation.
Which petrochemical segment experienced the largest percentage increase?
Synthetic caprolactam showed a notable rise of about 12.91% over the period.
Why did PTFE production decline during this timeframe?
Possible causes include higher raw‑material costs, limited feedstock supply and tighter environmental regulations.
How might the observed production patterns affect the automotive industry?
Growth in caprolactam benefits nylon‑based components, while stable polyester supplies support interior fabrics and coatings.
What should investors watch for in the upcoming quarters?
Key indicators include raw‑material price trends, policy updates on emissions, and demand shifts in downstream industries such as packaging and construction.