
Introduction
The Southern region of India recorded its energy power requirement for the quarter April‑June 2026, with a focus on the month of June. The data breaks down megawatt units (MU) needed by each state, juxtaposing total demand against the amount actually supplied. Understanding these figures is essential for utilities, investors, and policymakers who monitor grid stability, plan new generation capacity, and assess the balance between supply and demand. This article interprets the June 2026 numbers, highlights key state‑wise differences, and discusses implications for the broader Indian power sector.
What Does the Data Reveal About This Topic?
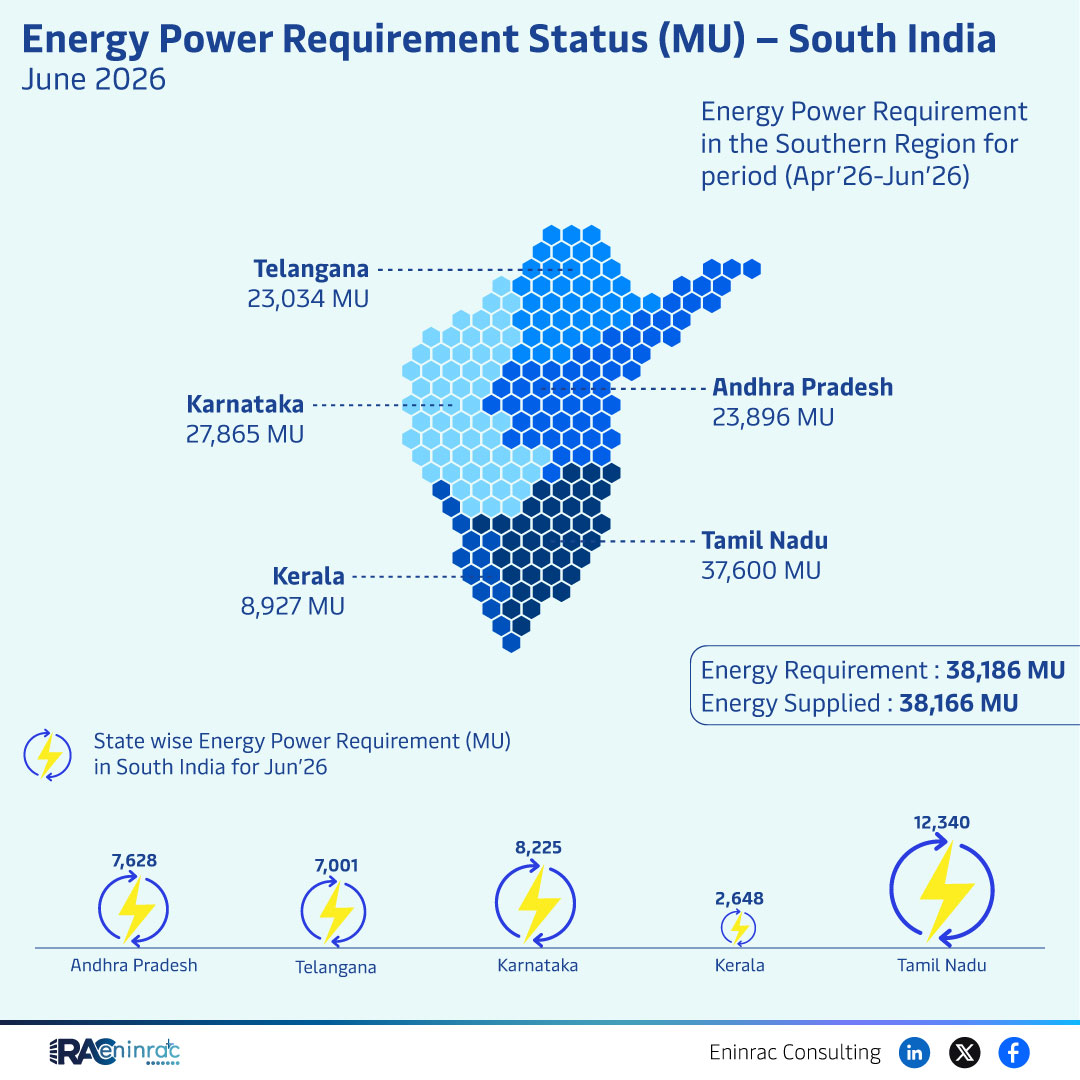
The data shows a total energy requirement of 38,186 MU and energy supplied of 38,166 MU, indicating a marginal shortfall of 20 MU. Telangana recorded the highest single‑state demand at 23,034 MU, while Karnataka’s requirement stood at 23,896 MU. Tamil Nadu led with the largest consumption figure of 37,600 MU, followed by Andhra Pradesh with 8,927 MU. Kerala contributed 12,340 MU in the state‑wise breakdown, and the remaining demand is distributed among the other states. The near‑balance between requirement and supply suggests that the grid managed to meet almost all of the projected load for June.
State‑wise Energy Demand Comparison for June 2026
When the numbers are placed side by side, clear regional patterns emerge. Tamil Nadu’s demand of 37,600 MU dwarfs the figures of its neighbours, reflecting its large industrial base and extensive residential consumption. Karnataka follows closely with 23,896 MU, driven by its growing manufacturing sector and increasing electrification of transport. Telangana’s 23,034 MU indicates strong growth in both commercial and agricultural power use. Andhra Pradesh’s 8,927 MU, though lower, still represents a significant share of the southern mix. Kerala’s 12,340 MU highlights the state’s focus on renewable integration while maintaining a steady load. These disparities help planners allocate resources and prioritize transmission upgrades.
Impact on Sectors and Industries
The observed demand profile influences several key sectors. Power generators must align capacity additions with the spikes seen in Tamil Nadu and Karnataka, encouraging investments in both conventional and renewable plants. Transmission operators are prompted to reinforce inter‑state corridors to smooth out imbalances. Investors in energy infrastructure can use the data to identify high‑growth markets, particularly where supply margins are thin. Policymakers may reconsider tariff structures or incentive schemes to promote demand‑side management in states with higher consumption. Finally, consumers benefit from a reliable grid that can closely match supply to the stated requirement, reducing the risk of outages.
Key Takeaways
- Overall demand 38,186 MU, supply 38,166 MU.
- Marginal shortfall of only 20 MU.
- Tamil Nadu records the highest consumption.
- Karnataka and Telangana show comparable high demand.
- Kerala’s demand reflects balanced renewable integration.
- Data guides capacity planning and investment decisions.
FAQs
What was the total energy requirement for South India in June 2026?
The total requirement was 38,186 megawatt units.
Which state had the highest energy demand?
Tamil Nadu, with 37,600 MU.
Did supply meet the demand?
Supply was 38,166 MU, falling short by 20 MU.
How does Karnataka’s demand compare to Telangana’s?
Karnataka required 23,896 MU, slightly higher than Telangana’s 23,034 MU.
Why is this data important for investors?
It highlights high‑growth markets and informs where new generation capacity is needed.