
Introduction
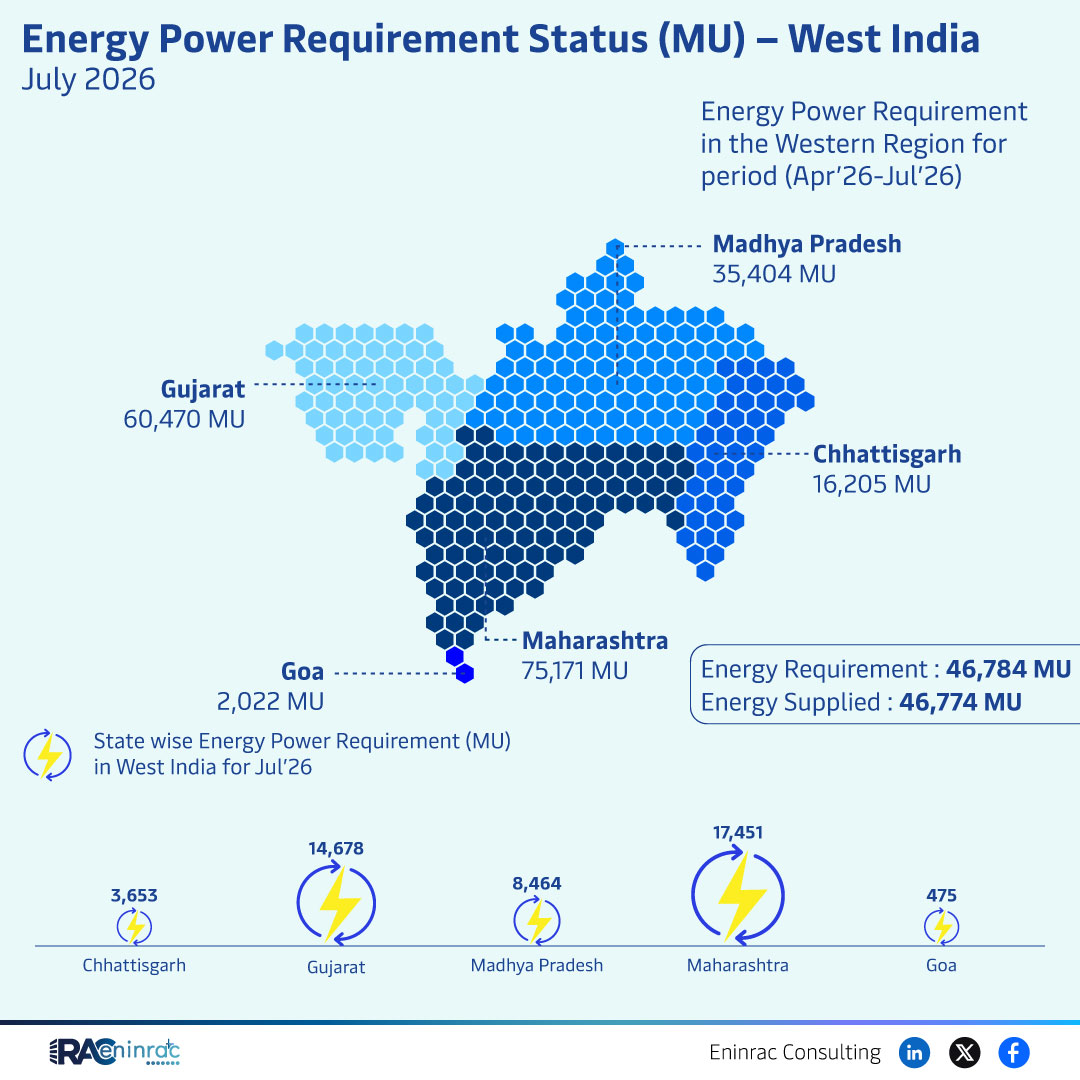
The July 2026 snapshot of West India energy power requirement offers a concise view of how regional electricity demand is shaping the broader Indian power landscape. Understanding this data matters for investors, policymakers, and utilities because it highlights where supply meets demand, where gaps remain, and which states dominate consumption. Readers will learn the state‑wise breakdown, key trends, and the implications of these figures for future energy planning and market opportunities.
What Does the Data Reveal About This Topic?
Does the July 2026 data show a balanced energy market across the western region? The figures indicate that total energy requirement stands at 46,784 MU with an almost equal supply of 46,774 MU, suggesting a tight but manageable equilibrium. However, disparities emerge when examining individual states: Gujarat leads with 60,470 MU, Maharashtra follows with 75,171 MU, while smaller contributors like Goa register lower demand. This variance underscores localized pressures on the grid.
State‑wise Demand Comparison in July 2026
When comparing states, Gujarat’s requirement of 60,470 MU surpasses the regional average, reflecting its industrial base and growing urban population. Maharashtra registers the highest demand at 75,171 MU, driven by extensive manufacturing hubs and a large consumer base. Chhattisgarh contributes a modest 16,205 MU, and Goa’s demand remains minimal, highlighting regional economic differences. The overall supply of 46,774 MU meets the total requirement closely, yet certain states experience marginal shortfalls that could affect reliability if not addressed.
Impact on Sectors and Industries
The West India energy power requirement data influences multiple sectors. Power generators must align capacity expansions with high‑demand states like Maharashtra and Gujarat, while renewable developers can target undersupplied areas to reduce gaps. Investors gain insight into where infrastructure spending may yield returns, and policymakers can craft region‑specific incentives to balance supply and demand. Consumers benefit from improved reliability as authorities address identified shortfalls, fostering economic growth across the western belt.
Key Takeaways
- Total regional requirement is 46,784 MU, matched closely by supply at 46,774 MU.
- Maharashtra records the highest demand at 75,171 MU, followed by Gujarat at 60,470 MU.
- Chhattisgarh and Goa show considerably lower demand, indicating lesser industrial activity.
- The near‑balance between supply and demand suggests limited excess capacity but also minimal surplus.
- Targeted investments in renewable and conventional generation are needed to address localized gaps.
- Policymakers should consider state‑specific strategies to ensure long‑term grid stability.
FAQs
What is the total energy requirement for West India in July 2026?
The region required 46,784 MU of electricity during that period.
Which state had the highest power demand?
Maharashtra led with a demand of 75,171 MU.
Was the supplied energy enough to meet the requirement?
Supply was 46,774 MU, nearly matching the requirement, leaving a slight shortfall.
How does Gujarat’s demand compare to the regional average?
Gujarat’s demand of 60,470 MU exceeds the average, reflecting strong industrial activity.
What implications does this data have for investors?
Investors can pinpoint high‑demand states for capacity expansion and renewable projects to close supply gaps.