
Introduction
The July 2026 energy power requirement report for South India presents a detailed snapshot of how the five major states are balancing electricity demand with available supply. With the region’s rapid industrial growth, urban expansion, and seasonal temperature spikes, understanding the gap between required megawatt units (MU) and actual generation is critical for planners, investors, and policymakers. This article interprets the latest figures, highlights which states are closest to meeting their needs, and outlines the broader implications for the regional power market.
What Does the Data Reveal About This Topic?
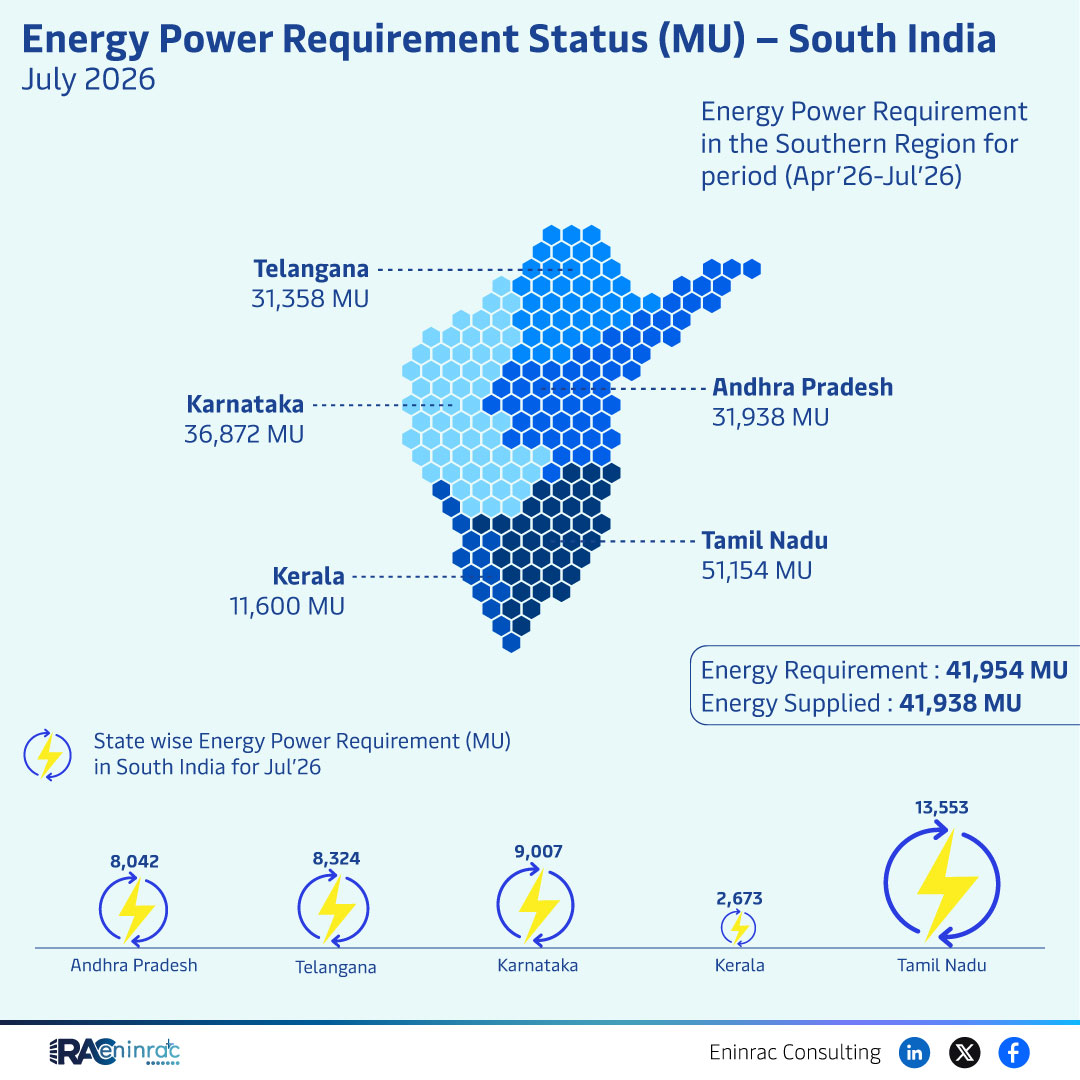
The central question is whether South India’s power system can satisfy the rising demand recorded for July 2026. The data shows a total requirement of 41,954 MU against an almost equal supply of 41,938 MU, leaving a marginal shortfall of 16 MU. While Tamil Nadu reports the highest individual demand at 51,154 MU, its supply figures are not provided, suggesting a potential deficit. Conversely, Telangana, Andhra Pradesh, Karnataka, and Kerala display tighter balances, indicating regional disparities that merit close monitoring.
Statewise Comparison of Energy Power Requirement and Supply
Examining the statewise numbers reveals distinct patterns. Telangana registers a requirement of 31,358 MU, while Karnataka stands slightly higher at 31,938 MU. Tamil Nadu’s demand peaks at 51,154 MU, far exceeding its neighboring states. The aggregate South India energy requirement for the April‑July 2026 window totals 41,954 MU, with a nearly matching supply of 41,938 MU, indicating a brief overall deficit. Smaller figures such as 13,553 MU for an unspecified region and 8,042 MU, 8,324 MU and 7,007 MU for other sub‑areas hint at localized shortfalls that could affect grid stability if not addressed promptly.
Impact on Sectors and Industries
The modest gap between demand and supply influences multiple sectors. Power‑intensive industries like steel, chemicals, and IT services must anticipate potential curtailments, especially in Tamil Nadu where demand outpaces reported supply. Investors looking at renewable and conventional generation projects will weigh the tight balances in Telangana and Karnataka as signals of near‑term capacity needs. Policymakers can use these insights to prioritize transmission upgrades, incentivize distributed generation, and align energy‑price mechanisms with actual consumption trends across the Southern region.
Key Takeaways
- Overall South India requirement of 41,954 MU nearly matches supply, leaving only a 16 MU shortfall.
- Tamil Nadu shows the highest demand at 51,154 MU, indicating possible localized deficits.
- Telangana and Karnataka have similar requirements around 31,000 MU, suggesting balanced demand‑supply dynamics.
- Kerala and Andhra Pradesh exhibit lower but still significant demand, highlighting the need for regional planning.
- Small sub‑regional gaps (e.g., 13,553 MU) could affect grid reliability if not addressed.
- Investors and policymakers should focus on capacity expansion in high‑demand states to prevent future shortages.
FAQs
What is the total energy power requirement for South India in July 2026?
The combined demand across the five states is 41,954 megawatt units.
How does actual supply compare to the requirement?
Supply is 41,938 MU, creating a marginal shortfall of 16 MU.
Which state has the highest power demand?
Tamil Nadu leads with a reported requirement of 51,154 MU.
Are there any states meeting their demand exactly?
Telangana, Andhra Pradesh, Karnataka, and Kerala show near‑balanced figures, but exact parity is not confirmed.
What does this data mean for energy investors?
It highlights where new generation capacity or grid upgrades are most needed, especially in high‑demand states like Tamil Nadu.