
Introduction
The August 2026 energy power requirement report for West India provides a detailed snapshot of electricity demand across key states in the western region. Understanding this data is crucial for policymakers, investors, and industry stakeholders who need to balance supply and demand, plan infrastructure, and assess market opportunities. This article explains the statewise figures, highlights the most significant trends, and offers insights into how the 46,986 MU of power supplied aligns with regional needs.
What Does the Data Reveal About This Topic?
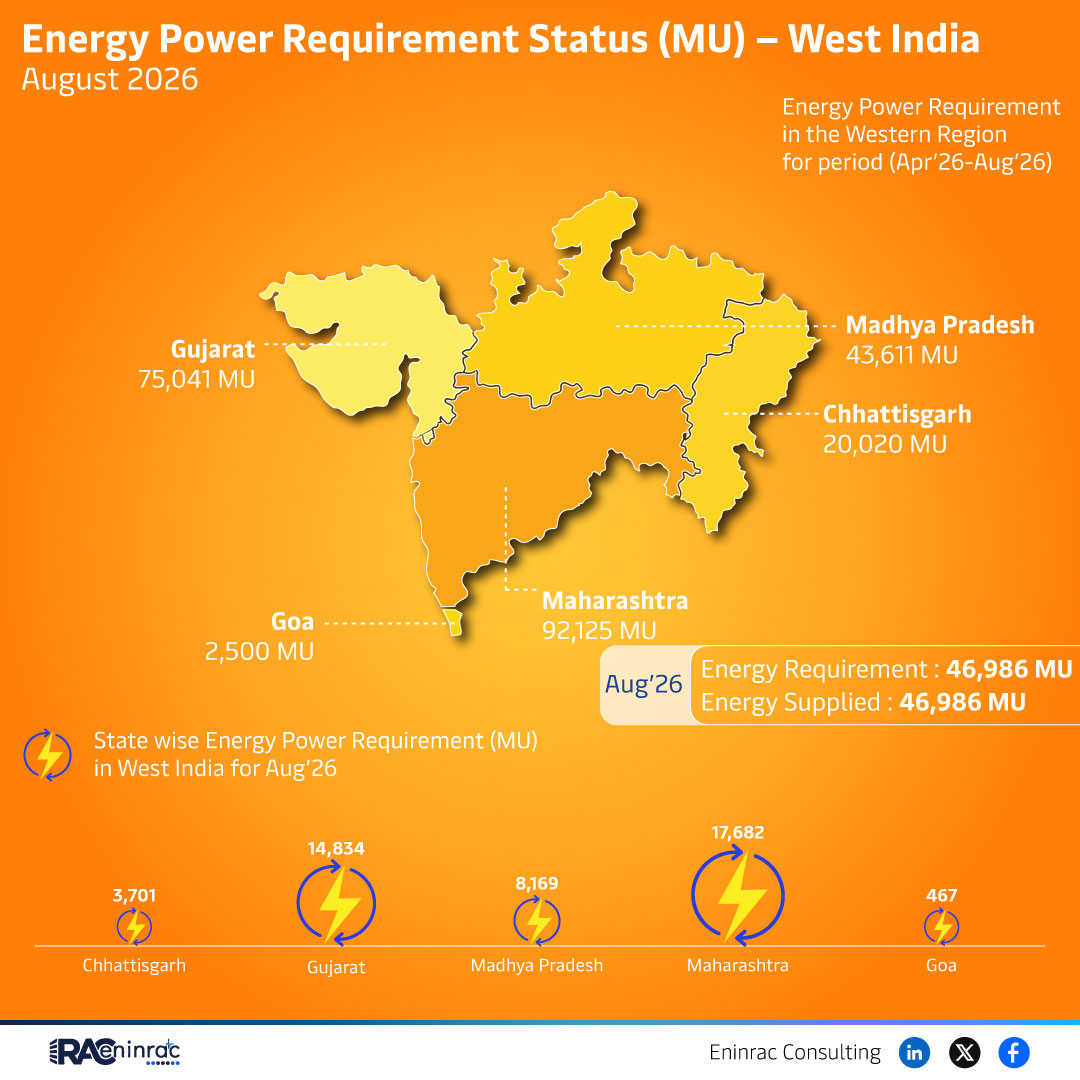
What does the August 2026 data reveal about West India’s energy demand? The report shows that the total energy requirement for the period April to August 2026 reached 46,986 MU, exactly matching the amount supplied. However, the distribution of demand varies dramatically among states, with Madhya Pradesh and Gujarat accounting for the largest shares, while smaller states such as Goa and Chhattisgarh contribute modest amounts.
Statewise Energy Demand Highlights for August 2026
Comparative analysis of the statewise figures uncovers distinct patterns. Gujarat recorded a demand of 43,611 MU, making it a leading consumer in the western corridor. Madhya Pradesh displayed an even higher requirement of 75,041 MU, reflecting its extensive industrial base and growing urban consumption. Chhattisgarh’s demand stood at 20,020 MU, while Goa contributed 2,500 MU, indicating a lower but still significant need for power. Additional data points show Maharashtra with 17,682 MU and another figure of 14,834 MU, suggesting a split between different districts or reporting periods. The alignment of total supply with total demand underscores effective short‑term planning, yet the variability among states points to the need for targeted capacity expansion.
Impact on Sectors and Industries
The energy requirement landscape influences multiple sectors. Heavy‑industry hubs in Madhya Pradesh and Gujarat rely on stable power to sustain manufacturing output, while the service‑oriented economies of Maharashtra and Goa depend on reliable electricity for tourism and commerce. Accurate demand forecasting supports utilities in optimizing grid operations and reduces the risk of outages. Investors can identify high‑growth markets for power generation projects, particularly in states where demand outpaces current infrastructure. Policymakers gain a clearer picture of where to allocate funds for transmission upgrades, renewable integration, and demand‑side management programs.
Key Takeaways
- Madhya Pradesh leads with the highest August 2026 power requirement at 75,041 MU.
- Gujarat follows closely with a demand of 43,611 MU, highlighting its industrial vigor.
- Chhattisgarh and Goa have relatively modest needs of 20,020 MU and 2,500 MU respectively.
- The total regional demand of 46,986 MU is fully met by the supplied amount, indicating short‑term equilibrium.
- Disparities among states suggest targeted investments are needed to avoid future shortfalls.
- Accurate data supports better policy decisions, grid planning, and investor confidence.
FAQs
What is the total energy requirement for West India in August 2026?
The total requirement for the western region during the April‑August 2026 period was 46,986 MU.
Which state had the highest power demand?
Madhya Pradesh recorded the highest demand at 75,041 MU.
Did the region meet its energy demand?
Yes, the supplied power exactly matched the reported requirement of 46,986 MU.
How does Gujarat’s demand compare to other states?
Gujarat’s demand of 43,611 MU places it among the top consumers, second only to Madhya Pradesh.
Why are statewise figures important for investors?
Statewise data highlights where capacity gaps exist, guiding investors toward regions with the greatest growth potential for power projects.