
Introduction
The Southern Region of India recorded its energy power requirement for August 2026, providing a clear snapshot of demand across key states. Understanding these figures is essential for policymakers, investors, and industry stakeholders who monitor supply‑demand balance, plan infrastructure upgrades, and assess market pressures. This article explains the August 2026 numbers, compares state‑wise needs, and highlights the implications for the broader energy landscape in South India.
What Does the Data Reveal About This Topic?
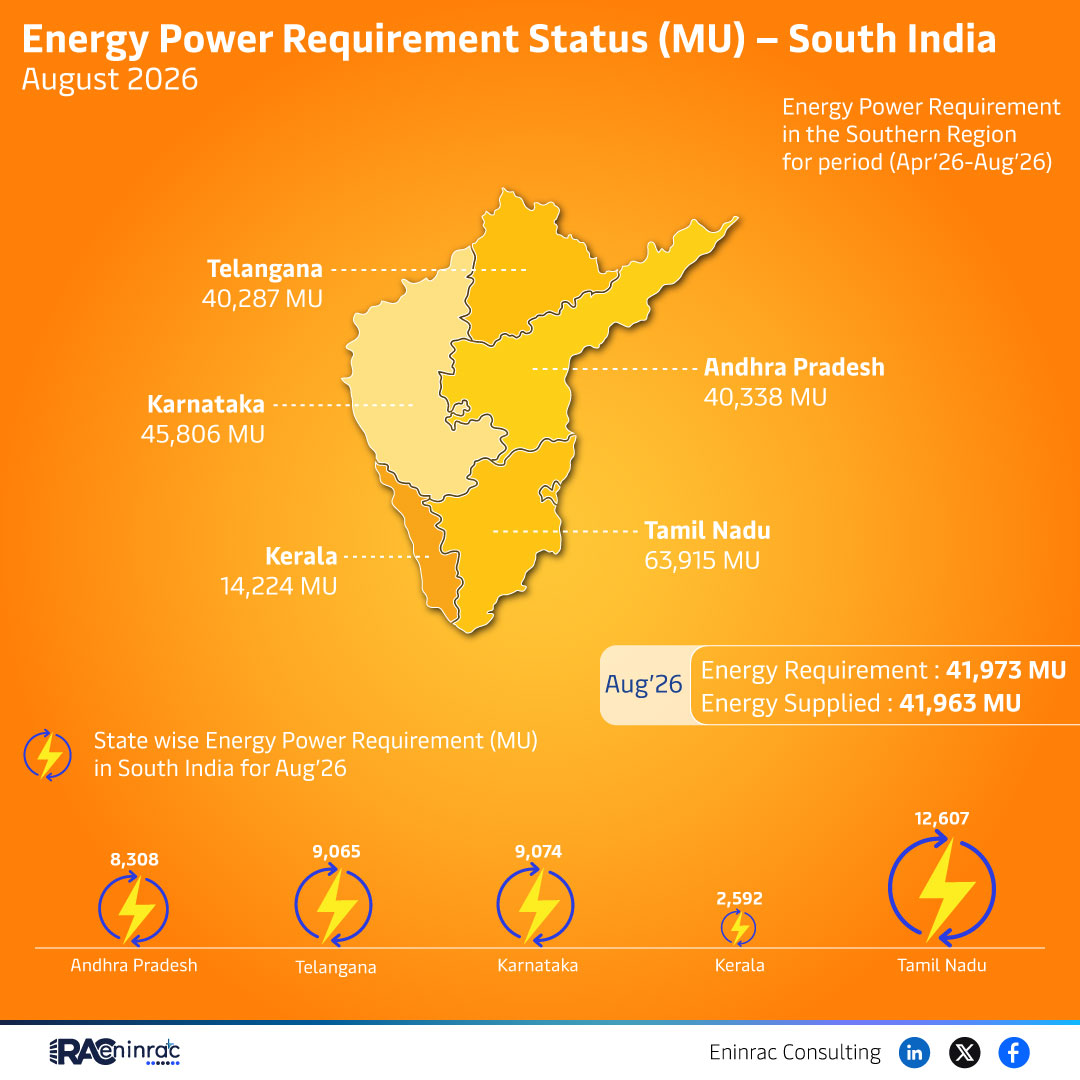
The data shows that the total energy requirement for the Southern Region during the April‑August 2026 window was 41,973 MU, while the supplied amount was 41,963 MU, leaving a marginal shortfall of just ten MU. This near‑perfect match indicates effective coordination between generation assets and demand drivers. It also suggests that the region is approaching a state of equilibrium, where marginal adjustments in capacity or consumption could tilt the balance.
State‑wise Energy Demand Highlights August 2026
State‑level analysis uncovers notable variations. Telangana reported a requirement of 40,287 MU, reflecting its rapid industrial growth and expanding urban centers. Karnataka’s demand stood at 40,338 MU, driven by its technology hub and manufacturing base. Kerala contributed 45,806 MU, a figure that includes significant residential consumption and a growing tourism sector. Andhra Pradesh, Telangana, Karnataka, and Kerala also displayed specific monthly figures of 12,607 MU, 8,308 MU, 9,065 MU, and 9,074 MU respectively, illustrating the distribution of load across the region. Tamil Nadu, while not listed with a precise value, remains a major consumer in the South.
Impact on Sectors and Industries
The near‑balanced supply‑demand scenario influences multiple sectors. Power‑intensive industries such as steel, cement, and automotive can plan production without fearing sudden blackouts. Renewable developers gain confidence that grid capacity can integrate new solar and wind projects. Financial investors see reduced risk for energy‑related assets, while regulators can fine‑tune tariffs and incentives to maintain stability. Consumers benefit from reliable electricity, which supports economic activities ranging from small enterprises to large‑scale agribusiness.
Key Takeaways
- The Southern Region’s total demand in August 2026 was 41,973 MU.
- Energy supplied matched demand within a ten‑MU margin, indicating tight grid management.
- Karnataka and Telangana each required over 40,000 MU, highlighting high industrial load.
- Kerala’s demand exceeded 45,000 MU, driven by residential and tourism usage.
- State‑wise figures reveal uneven distribution, urging targeted infrastructure investment.
- Balanced supply supports sector growth, renewable integration, and investor confidence.
FAQs
What does MU stand for in energy reporting?
MU stands for Million Units, a standard measure for large‑scale electricity consumption and generation.
Why is the supply only ten MU short of demand?
The small shortfall reflects minor forecasting deviations and temporary operational constraints.
Which state has the highest energy requirement?
Kerala shows the highest recorded requirement at 45,806 MU for the period.
How does this data affect renewable energy projects?
Stable supply‑demand balance encourages investment in renewable capacity, as grid reliability is assured.
Can policymakers use this data for future planning?
Yes, the figures help design capacity additions, demand‑side management, and regional energy policies.