
Introduction
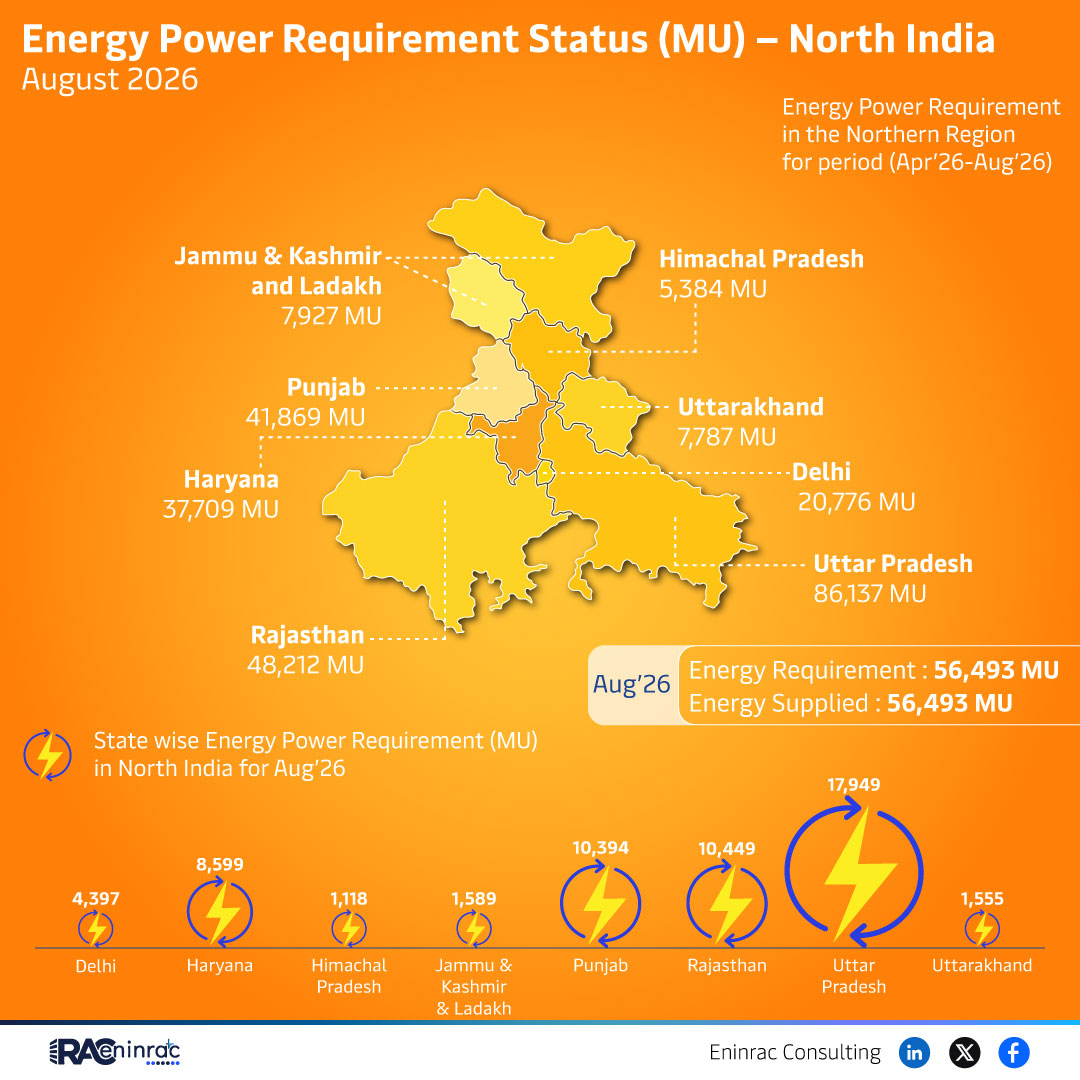
The August 2026 energy power requirement report for North India presents an aggregated view of electricity demand measured in million units (MU) across key states during the April‑August 2026 window. Understanding this demand profile is essential for policymakers, utilities, investors, and analysts who plan capacity additions, grid upgrades, and financing strategies. The data highlights regional disparities, showcases the scale of consumption in the most energy‑intensive states, and offers a baseline for future forecasting and policy alignment.
What Does the Data Reveal About This Topic?
The core insight from the raw figures is that Uttar Pradesh dominates the North India energy power requirement landscape, accounting for roughly 86,137 MU—far above any other state. Haryana follows with 37,709 MU, while Punjab contributes approximately 20,776 MU. Smaller but notable contributors include Delhi (10,394 MU), Jammu & Kashmir & Ladakh (7,927 MU), Himachal Pradesh (1,869 MU), and the combined figures for Rajasthan and Uttarakhand (around 8,599 MU each). The total requirement of 56,493 MU matches the supplied volume, indicating a balanced supply‑demand scenario for the reporting period.
State‑wise Energy Power Requirement Overview
When the numbers are placed side by side, a clear hierarchy emerges. Uttar Pradesh’s demand, driven by its large population and industrial base, dwarfs the next highest state, Haryana, by more than double. Punjab’s moderate demand reflects its agricultural and manufacturing mix, while Haryana’s elevated figure signals significant industrial consumption and growing urban loads. Delhi’s demand, though lower in absolute terms, is intense per capita due to its dense urban environment. The combined requirement of Jammu & Kashmir and Ladakh, despite geographical challenges, underscores the expanding reach of electrification initiatives. Himachal Pradesh’s modest demand aligns with its smaller industrial footprint and reliance on hydroelectric generation. Rajasthan and Uttarakhand, each around 8,600 MU, show balanced demand driven by tourism, mining, and emerging manufacturing sectors.
Impact on Sectors and Industries
These demand patterns influence multiple sectors. Power generation companies must align capacity expansion, especially in thermal and renewable plants, to meet Uttar Pradesh’s towering needs. Transmission operators face pressure to reinforce inter‑state corridors and reduce bottlenecks. Investors see higher returns potential in projects targeting high‑demand states, while renewable developers can leverage policy incentives to replace conventional capacity in regions like Himachal and Uttarakhand. Policymakers gain a data‑driven basis for designing tariffs, subsidy allocations, and grid stability measures, ensuring that supply remains resilient amid rising consumption.
Key Takeaways
- Uttar Pradesh leads North India with 86,137 MU, outpacing all other states.
- Haryana’s 37,709 MU marks it as the second‑largest consumer, highlighting industrial growth.
- Punjab, Delhi, and Jammu & Kashmir & Ladakh together contribute over 30,000 MU, reflecting diverse demand drivers.
- Total requirement (56,493 MU) equals total supplied volume, indicating short‑term equilibrium.
- Regional planners must prioritize grid reinforcement in high‑demand corridors.
- Investors can target Uttar Pradesh and Haryana for large‑scale generation and transmission projects.
FAQs
Which state has the highest power requirement in August 2026?
Uttar Pradesh, with an estimated requirement of 86,137 MU.
How does Haryana’s demand compare to Punjab’s?
Haryana’s demand (≈37,709 MU) is nearly double Punjab’s (≈20,776 MU).
Is the supplied electricity meeting the total demand?
Yes, the reported supply of 56,493 MU matches the total requirement for the period.
What implications does this data have for renewable energy investors?
Investors can focus on high‑demand states like Uttar Pradesh and Haryana to develop large‑scale renewable projects that complement existing supply.
Why is Himachal Pradesh’s demand relatively low?
Its smaller industrial base and reliance on hydroelectric resources keep its requirement around 1,869 MU.