
Introduction
The August 2026 energy power requirement data for East India provides a snapshot of how much electricity each state in the region needed during a critical mid‑year period. Understanding this demand is essential for utilities, policymakers, and investors who are planning capacity expansion, grid upgrades, or renewable integration. In this article we explore the figures for Bihar, Jharkhand, Odisha, West Bengal and Sikkim, compare requirement versus supply, and discuss what the numbers mean for the broader energy landscape of East India.
What Does the Data Reveal About This Topic?
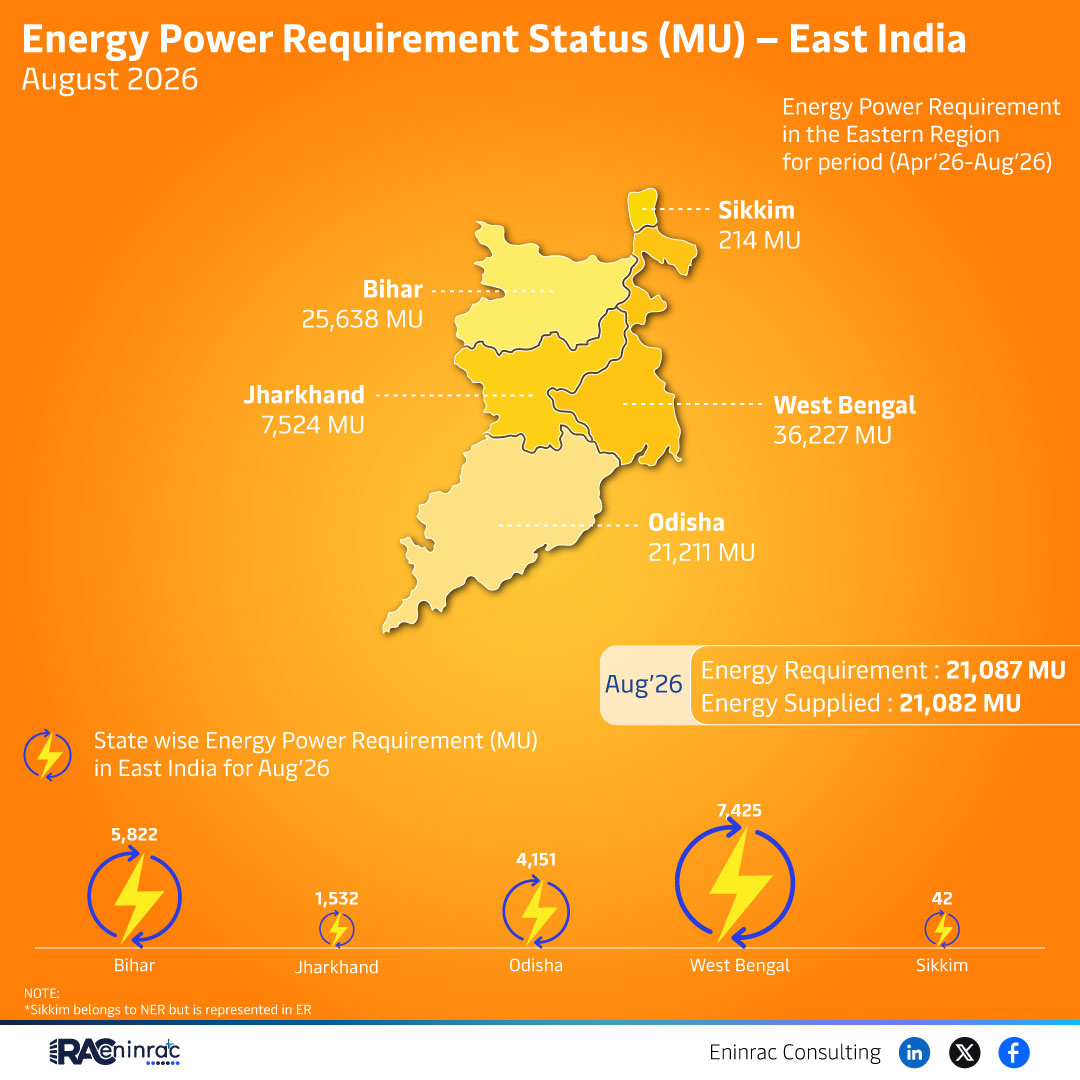
The raw figures show a total regional requirement of 21,087 million units (MU) with actual supply reaching 21,082 MU, leaving a narrow shortfall of five MU. State‑wise, West Bengal exhibited the highest demand at roughly 7,425 MU, followed by Bihar at about 5,822 MU. Odisha’s need was around 4,511 MU, while Jharkhand and Sikkim recorded lower but still significant values. The data answers a key question: Is the East Indian grid meeting its demand? The answer is largely yes, but the small deficit highlights the need for contingency planning.
State‑wise Comparison of August 2026 Power Needs
When we break down the numbers, West Bengal leads the region with the greatest load, reflecting its dense industrial base and large population. Bihar’s demand is driven by rapid urbanisation and agricultural processing activities. Odisha, while having a smaller population, shows a considerable requirement due to its mining and metal‑processing sectors. Jharkhand’s demand aligns with its coal‑centric economy, and Sikkim, though part of the North‑Eastern region, is included here and presents a modest need of just over 200 MU. The close match between total supply and demand suggests that most states received adequate power, but the slight gap could become critical during peak heat waves or unexpected outages.
Impact on Sectors and Industries
Accurate power requirement data influences several sectors. Utilities use these figures to schedule generation, manage transmission bottlenecks, and decide where to locate new substations. Investors in renewable projects examine shortfalls to identify viable locations for solar or wind farms that can offset deficits. Policymakers leverage the information to set tariffs, incentivise energy efficiency, and design demand‑response programmes. For industrial users, knowing the regional supply reliability helps in capacity planning and in negotiating power purchase agreements.
Key Takeaways
- East India’s total power requirement for August 2026 was 21,087 MU.
- Actual supply reached 21,082 MU, leaving a five‑MU shortfall.
- West Bengal recorded the highest state‑wise demand at roughly 7,425 MU.
- Bihar and Odisha followed with 5,822 MU and about 4,511 MU respectively.
- Jharkhand and Sikkim contributed lower but notable demand figures.
- The narrow supply‑demand gap underscores the importance of grid flexibility and backup resources.
FAQs
What is the total energy requirement for East India in August 2026?
The region required 21,087 million units (MU) of power during that month.
Did East India meet its power demand in August 2026?
Supply was 21,082 MU, just five MU short of the total requirement.
Which state had the highest power demand?
West Bengal, with approximately 7,425 MU, led the demand chart.
How does the shortfall affect industrial operations?
A five‑MU gap is small but can strain industries during peak usage, prompting reliance on backup generators.
Why is Sikkim included in East India data?
Sikkim belongs to the North‑Eastern region but is represented here for comparative analysis.