
Introduction
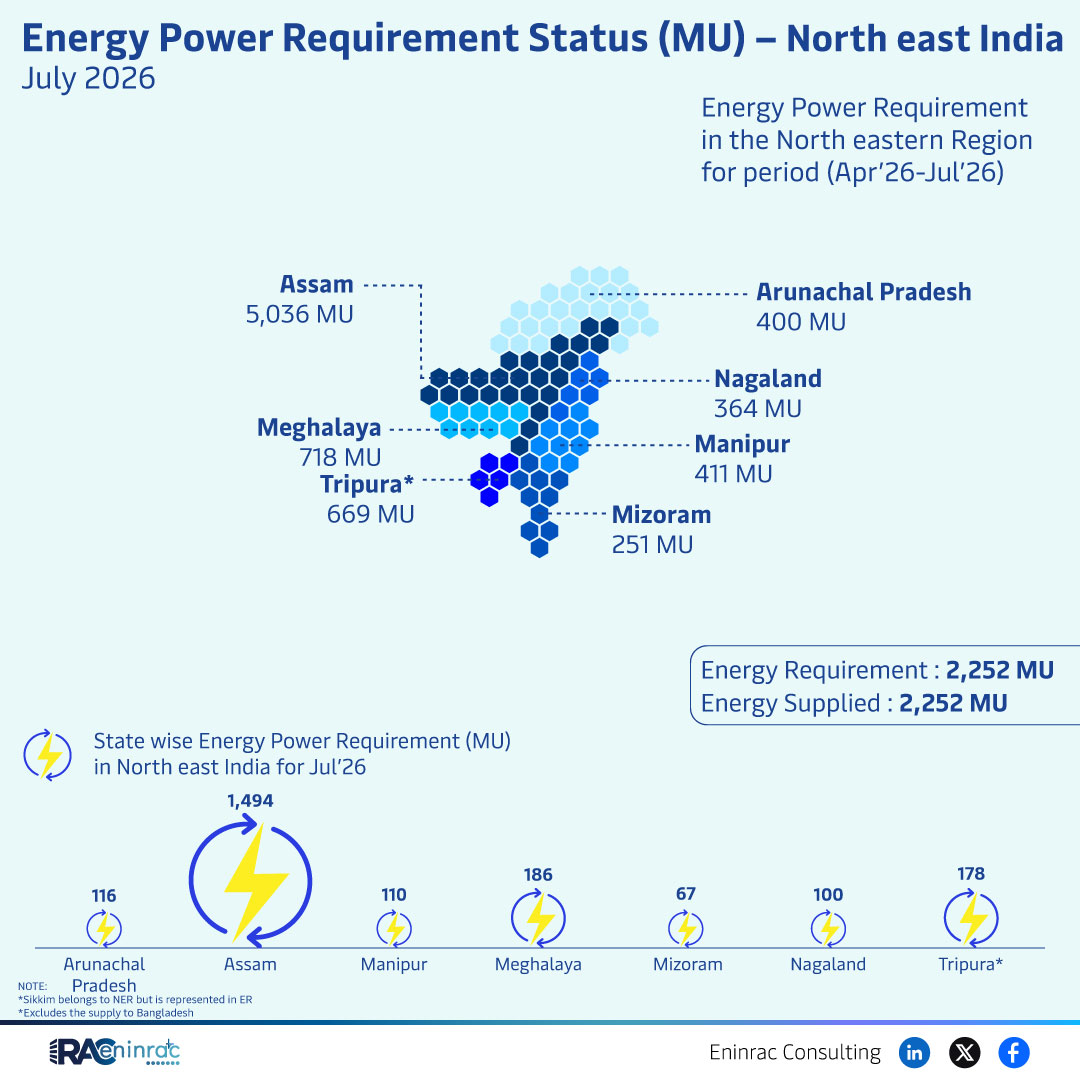
North East India’s electricity landscape in July 2026 is captured in a concise dataset that outlines the region’s total power requirement of 2,252 megawatt units (MU) and confirms that supply exactly matches demand. The North East India power requirement shown in the data demonstrates a balanced market for the month. The data breaks down the requirement by state, highlighting the varying needs of Arunachal Pradesh, Assam, Manipur, Meghalaya, Mizoram, Nagaland and Tripura. Understanding these figures is essential for policymakers, investors and utilities who must align generation, transmission and financing decisions with real‑world demand. This article interprets the raw numbers, compares statewise consumption, examines implications for the broader energy sector and offers actionable insights for stakeholders across the power value chain.
What Does the Data Reveal About This Topic?
The key question is whether the North East Indian grid can meet the projected demand without shortfalls. The answer, according to the July 2026 figures, is affirmative: the total requirement of 2,252 MU is fully supplied, indicating a balanced supply‑demand equation for the reporting period. However, the statewise breakdown uncovers significant disparities. Arunachal Pradesh accounts for the largest single demand at 400 MU, while Nagaland’s need stands at 364 MU and Mizoram at 669 MU, reflecting differing levels of industrial activity, population density and infrastructure development. Smaller states such as Assam, Manipur and Meghalaya show modest requirements, suggesting opportunities for targeted capacity expansion or demand‑side management.
Statewise Power Demand Analysis for July 2026
The comparative view reveals that Mizoram, with 669 MU, commands the highest share of the region’s power pool, representing nearly 30 % of the total demand. Arunachal Pradesh follows with 400 MU, while Nagaland’s 364 MU places it in the mid‑range. The remaining states—Assam, Manipur, Meghalaya and Tripura—collectively contribute less than 20 % of the overall requirement, indicating lower consumption intensity or limited industrial bases. These variations align with known economic patterns: Mizoram’s recent hydro and solar projects have boosted its load, Arunachal’s strategic military installations drive higher demand, and Nagaland’s growing manufacturing sector adds pressure on its grid. Understanding these nuances helps prioritize investment where capacity gaps are most acute.
Impact on Sectors and Industries
The observed demand profile influences several sectors across North East India. Utilities must align generation portfolios with state‑specific peaks, prompting greater reliance on hydro, solar and emerging battery storage to meet Mizoram’s expanding load. Infrastructure developers see clear signals for transmission upgrades, especially on corridors linking Arunachal and Mizoram to the national grid. Investors in renewable projects gain confidence from the balanced supply‑demand picture, while conventional power producers may reassess capacity in lower‑demand states. Policymakers can leverage the data to design targeted subsidies, incentivize demand‑side efficiency, and plan future inter‑state power exchanges that reduce regional disparities.
Key Takeaways
- Total power requirement for July 2026 in North East India equals 2,252 MU, fully matched by supply.
- Mizoram leads with 669 MU demand, accounting for nearly one‑third of regional consumption.
- Arunachal Pradesh and Nagaland together account for roughly 34 % of total demand.
- Smaller states (Assam, Manipur, Meghalaya, Tripura) represent less than 20 % of the overall requirement.
- Balanced supply‑demand suggests short‑term grid stability but highlights need for targeted capacity upgrades.
- Data underscores investment opportunities in hydro, solar and storage to support state‑specific growth.
FAQs
What was the total power requirement for North East India in July 2026?
The region required 2,252 megawatt units (MU) of electricity for the month.
Which state had the highest electricity demand in the region?
Mizoram recorded the highest demand at 669 MU.
How does the supply compare to the demand for this period?
Supply exactly matched demand, with 2,252 MU both required and supplied.
Why do demand levels vary significantly among the states?
Differences stem from varying industrial activity, population density, infrastructure projects and regional development priorities.
What implications does this data have for future energy investments?
It highlights opportunities for expanding hydro, solar and storage capacity, especially in high‑demand states, and suggests targeted transmission upgrades in lower‑demand areas.