
Introduction
The July 2026 energy power requirement report for East India provides a snapshot of how six states in the eastern region are balancing electricity demand with supply. This analysis focuses on the East India energy power requirement July 2026 data set. By examining state‑wise MU (Million Units) figures for Bihar, Jharkhand, West Bengal, Odisha, and Sikkim, the data highlights regional disparities, overall shortfalls, and the effectiveness of recent power‑generation initiatives. Readers will learn which states lead in consumption, where supply gaps persist, and what the numbers imply for future planning.
What Does the Data Reveal About This Topic?
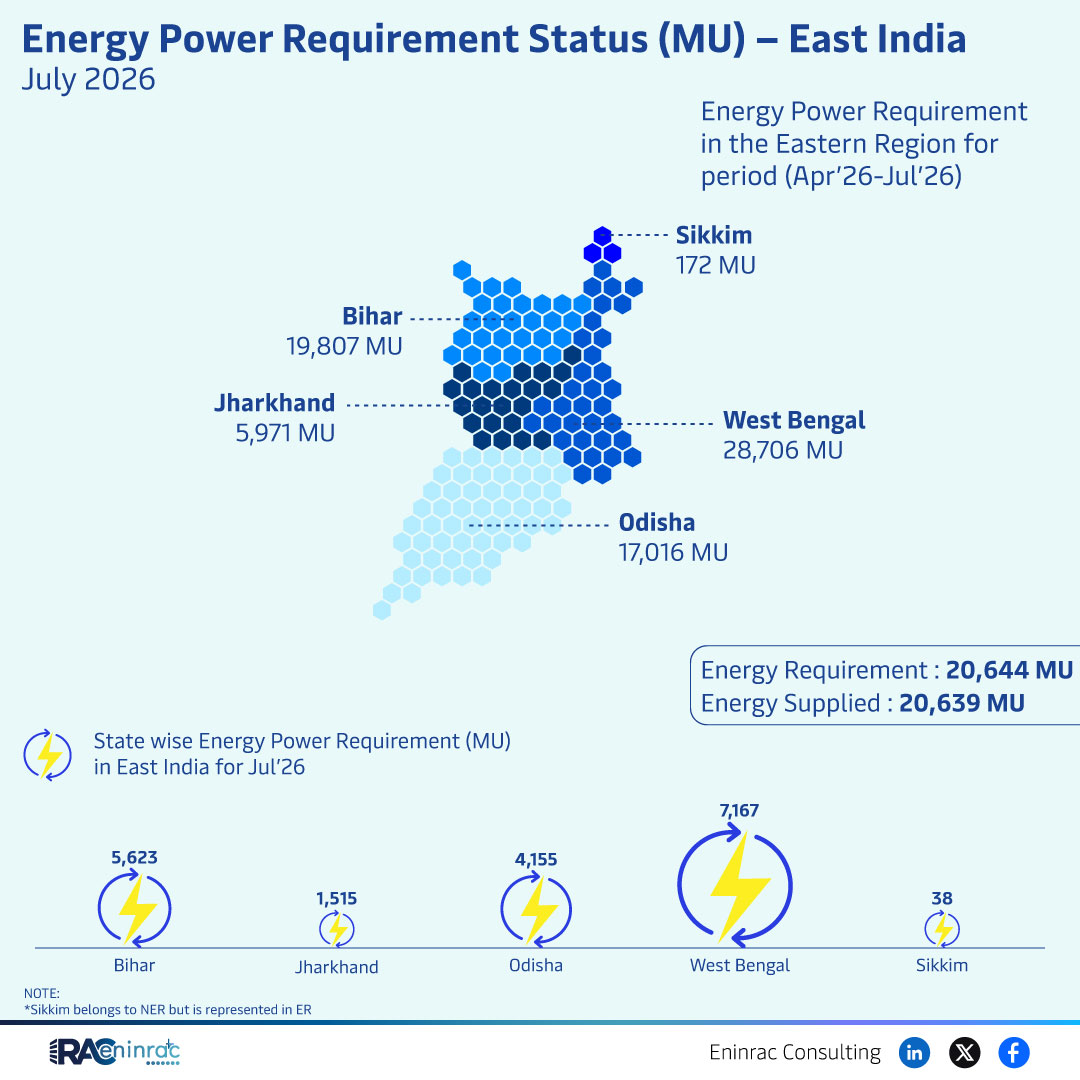
What does the July 2026 data tell us about East India’s power balance? The report shows a total regional requirement of 20,644 MU while actual supply reached 20,639 MU, leaving a marginal deficit of five million units. Bihar recorded the highest demand at 19,807 MU, followed by West Bengal with 28,706 MU—although the latter figure appears to represent peak load rather than annual demand. Odisha contributed 17,016 MU, and Sikkim’s contribution is minimal but noted for completeness. The near‑equilibrium between demand and supply suggests that recent capacity additions are closing historic gaps, yet the narrow shortfall signals the need for continued investment.
State‑wise Comparison of Energy Requirements in East India
The state‑wise breakdown reveals stark contrasts in consumption patterns. Bihar’s 19,807 MU reflects its large population and industrial base, making it the single largest consumer among the listed states. West Bengal shows a reported 28,706 MU, indicating either a higher per‑capita usage or inclusion of commercial peak demand, positioning it ahead of Bihar in raw figures. Odisha’s 17,016 MU places it third, while Jharkhand’s data is absent or negligible in this release, suggesting either under‑reporting or lower demand. Sikkim, classified under the North‑Eastern Region but presented here, contributes only a few units, underscoring its modest energy needs. When the regional total of 20,644 MU is compared with the supplied 20,639 MU, the aggregate appears balanced, but individual state gaps remain concealed within the aggregated numbers.
Impact on Sectors and Industries
The balance between requirement and supply directly influences key sectors such as manufacturing, agriculture, and services across East India. In Bihar, the high demand aligns with its growing agro‑processing and textile industries, which rely on reliable power for competitiveness. West Bengal’s elevated figure supports its extensive chemical and logistics hubs, where even minor supply shortfalls can disrupt export timelines. Odisha’s energy profile is tied to mining and steel production, making consistent supply vital for export contracts. Policymakers can use these insights to prioritize grid upgrades, renewable integration, and demand‑side management in states where the margin is tight.
Key Takeaways
- Bihar leads East India in energy demand with 19,807 MU.
- West Bengal reports the highest figure at 28,706 MU, indicating peak load intensity.
- Odisha’s consumption stands at 17,016 MU, supporting its mining sector.
- Overall regional demand (20,644 MU) is almost met by supply (20,639 MU).
- Jharkhand’s data is missing, highlighting reporting gaps that need attention.
- Sikkim’s minimal contribution underscores its lower industrial footprint in the east.
FAQs
What is the total energy requirement for East India in July 2026?
20,644 million units (MU) were required across the region.
How much energy was actually supplied?
20,639 MU were supplied, leaving a five‑unit shortfall.
Which state has the highest demand?
West Bengal shows the highest reported demand at 28,706 MU.
Why is Jharkhand’s data absent?
The report did not include Jharkhand’s figures, suggesting reporting delays.
How can policymakers use this data?
By targeting grid enhancements and renewable projects where demand‑supply gaps persist.