
Introduction
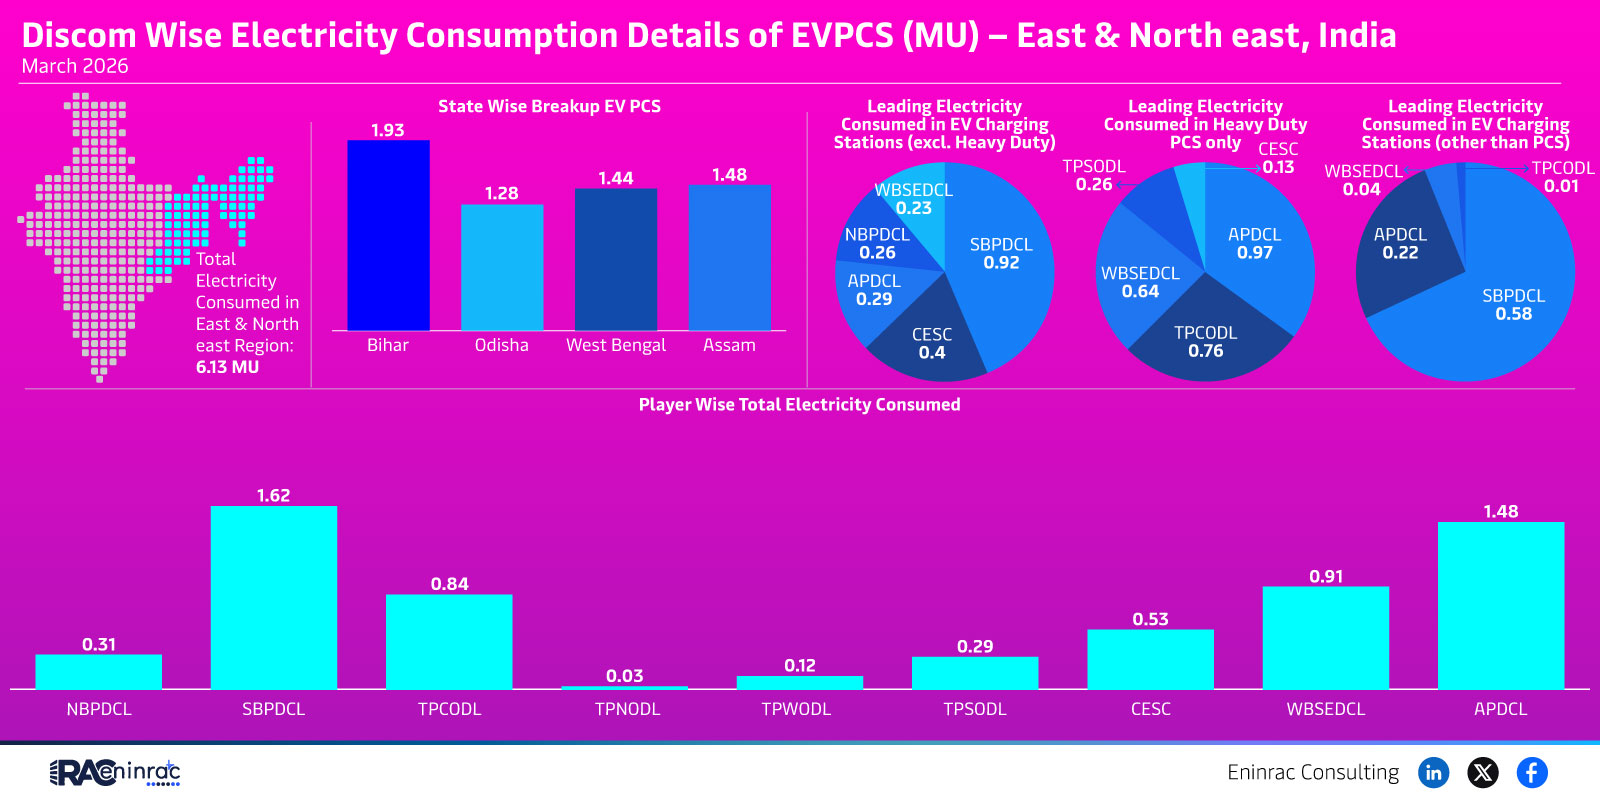
Eninrac Consulting recently evaluated the performance scores of two major Indian power distribution companies, SBPDCL and TPCODL. These scores, 0.58 for SBPDCL and 0.76 for TPCODL, provide a snapshot of operational efficiency, reliability, and customer service within the conventional energy sector. Understanding these metrics helps investors, policymakers, and industry analysts gauge how well each utility is meeting demand, managing assets, and adapting to regulatory changes. This article breaks down the data, compares the two entities, and explores the broader implications for the power distribution market.
What Does the Data Reveal About This Topic?
What does a 0.58 versus a 0.76 score indicate for SBPDCL and TPCODL? The higher score for TPCODL suggests stronger performance across key indicators such as outage management, revenue collection, and network modernization. In contrast, SBPDCL’s lower score points to challenges that may include higher transmission losses, slower adoption of smart grid technologies, or less effective cost recovery. The data therefore highlights a clear performance gap that can influence investment decisions and policy focus.
Comparative Performance of SBPDCL and TPCODL
When placed side by side, the SBPDCL and TPCODL scores illustrate divergent trajectories within the same regulatory environment. TPCODL’s 0.76 score places it near the top quartile of utilities surveyed this year, reflecting aggressive investment in infrastructure upgrades and a proactive approach to demand response. SBPDCL’s 0.58, while still acceptable, lags behind peers and signals the need for targeted improvements in asset management and customer outreach. Regional factors also play a role; TPCODL operates in a market with higher industrial growth, which can drive efficiency gains, whereas SBPDCL serves a more mixed residential and agricultural base that may limit economies of scale.
Impact on Sectors and Industries
The performance gap between SBPDCL and TPCODL has ripple effects across multiple sectors. For investors, higher scores often translate into lower perceived risk and better access to capital, encouraging fund inflows into utilities with strong operational metrics. Policymakers can use these insights to prioritize regulatory incentives for lagging utilities, fostering uniform service quality across regions. Renewable energy developers benefit from reliable distribution networks, and a utility with a higher score may attract more solar and wind projects due to reduced curtailment risk. Finally, consumers experience more stable electricity supply and potentially lower tariffs when utilities achieve higher efficiency.
Key Takeaways
- TPCODL outperforms SBPDCL with a 0.76 score versus 0.58.
- Higher scores correlate with better asset management and lower outage frequencies.
- Regional economic conditions influence utility performance outcomes.
- Investors view higher‑scoring utilities as lower‑risk opportunities.
- Policy incentives can help close performance gaps in the conventional energy sector.
- Improved distribution efficiency supports renewable integration and consumer satisfaction.
FAQs
What factors contribute to the score differences between SBPDCL and TPCODL?
Key factors include infrastructure investment, loss reduction initiatives, revenue collection efficiency, and the ability to integrate advanced grid technologies.
How can SBPDCL improve its performance score?
SBPDCL can focus on upgrading aging transmission assets, implementing smart metering, and strengthening financial management to boost its overall rating.
Do higher utility scores affect electricity tariffs for consumers?
Yes, utilities with higher efficiency often pass cost savings to consumers through lower or more stable tariffs.
What role does Eninrac Consulting play in this analysis?
Eninrac Consulting provides independent benchmarking and strategic recommendations that help utilities align with best‑practice standards.
Will these scores impact future renewable energy projects?
Utilities with higher scores are more attractive partners for renewable developers because they can reliably integrate variable generation sources.