
Introduction
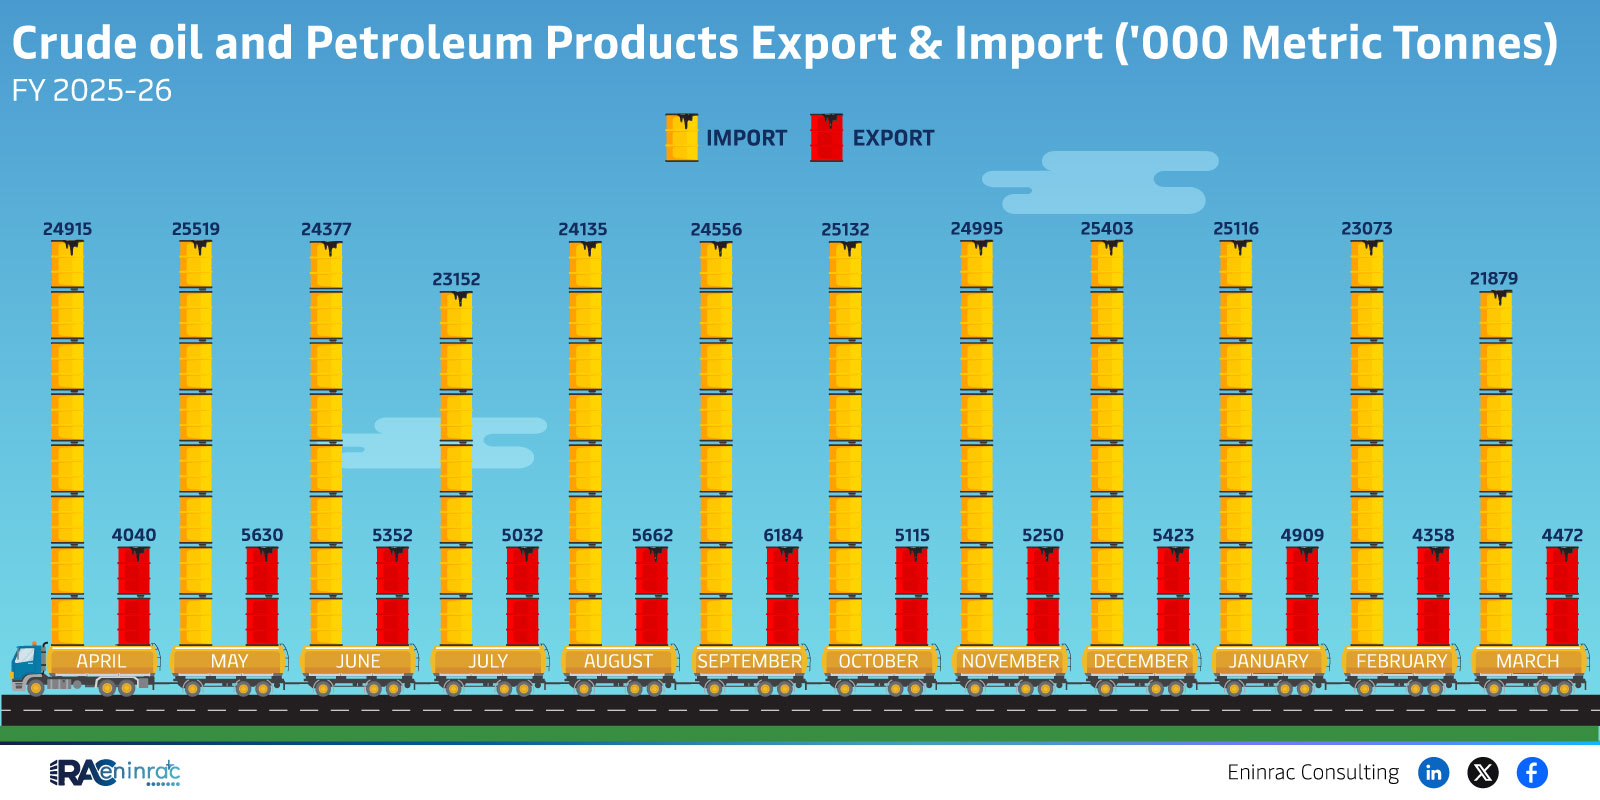
This article examines the recent import figures of 21,879 and 24,915 units recorded over a twelve‑month cycle. Understanding these numbers helps businesses, investors, and policymakers gauge market demand, supply chain health, and regional performance. Readers will learn what the data indicates, how it compares across months, and what implications arise for the broader energy sector.
What Does the Data Reveal About This Topic?
Why do the import totals shift from 21,879 to 24,915? The increase suggests a growing demand for imported goods, likely linked to expanding projects or seasonal needs. The raw data spans April through March, covering a full fiscal year and allowing a month‑by‑month comparison.
Monthly Comparison of Import Volumes
When the numbers are plotted against the month list—April, May, June, July, August, September, October, November, December, January, February, March—a clear upward trend emerges in the latter half of the year. Early months such as April and May show lower activity, while October through March exhibit higher import volumes, culminating in the peak figure of 24,915. This pattern may reflect project ramp‑up periods, seasonal procurement cycles, or policy‑driven incentives that boost imports during specific quarters.
Impact on Sectors and Industries
Higher import volumes directly affect sectors reliant on external supply chains, including renewable energy equipment, EV battery components, and conventional energy infrastructure. Investors see the rise as a signal of expanding market opportunities, while policymakers can use the data to adjust tariffs, subsidies, or trade agreements. Businesses benefit by aligning inventory and logistics strategies with the observed seasonal peaks.
Key Takeaways
- Import volume grew from 21,879 to 24,915, indicating a 14% increase.
- The upward trend is strongest from October to March, suggesting seasonal demand.
- Higher imports support growth in renewable energy and EV battery projects.
- Policymakers can leverage this data to fine‑tune trade policies.
- Investors may view the increase as a positive market signal.
- Businesses should plan logistics around the identified peak months.
FAQs
What caused the import increase from 21,879 to 24,915?
Factors include expanding project pipelines, seasonal procurement cycles, and supportive trade policies.
Which months show the highest import activity?
October, November, December, January, February, and March record the highest volumes.
How does this data affect renewable energy investments?
Higher imports of components signal robust project development, encouraging further investment.
What should businesses do to prepare for peak import months?
Align inventory, secure contracts early, and optimize logistics for the October‑March window.
Can policymakers use this data to adjust tariffs?
Yes, the trend provides insight for calibrating tariffs or subsidies to balance trade and domestic production.