
Introduction
India renewable energy generation June 2026 provides a snapshot of how solar, wind, large hydro, small hydro, and biomass contributed to the nation’s power mix. Understanding these numbers helps policymakers, investors, and analysts gauge progress toward climate goals and identify growth opportunities across the sector.
What Does the Data Reveal About This Topic?
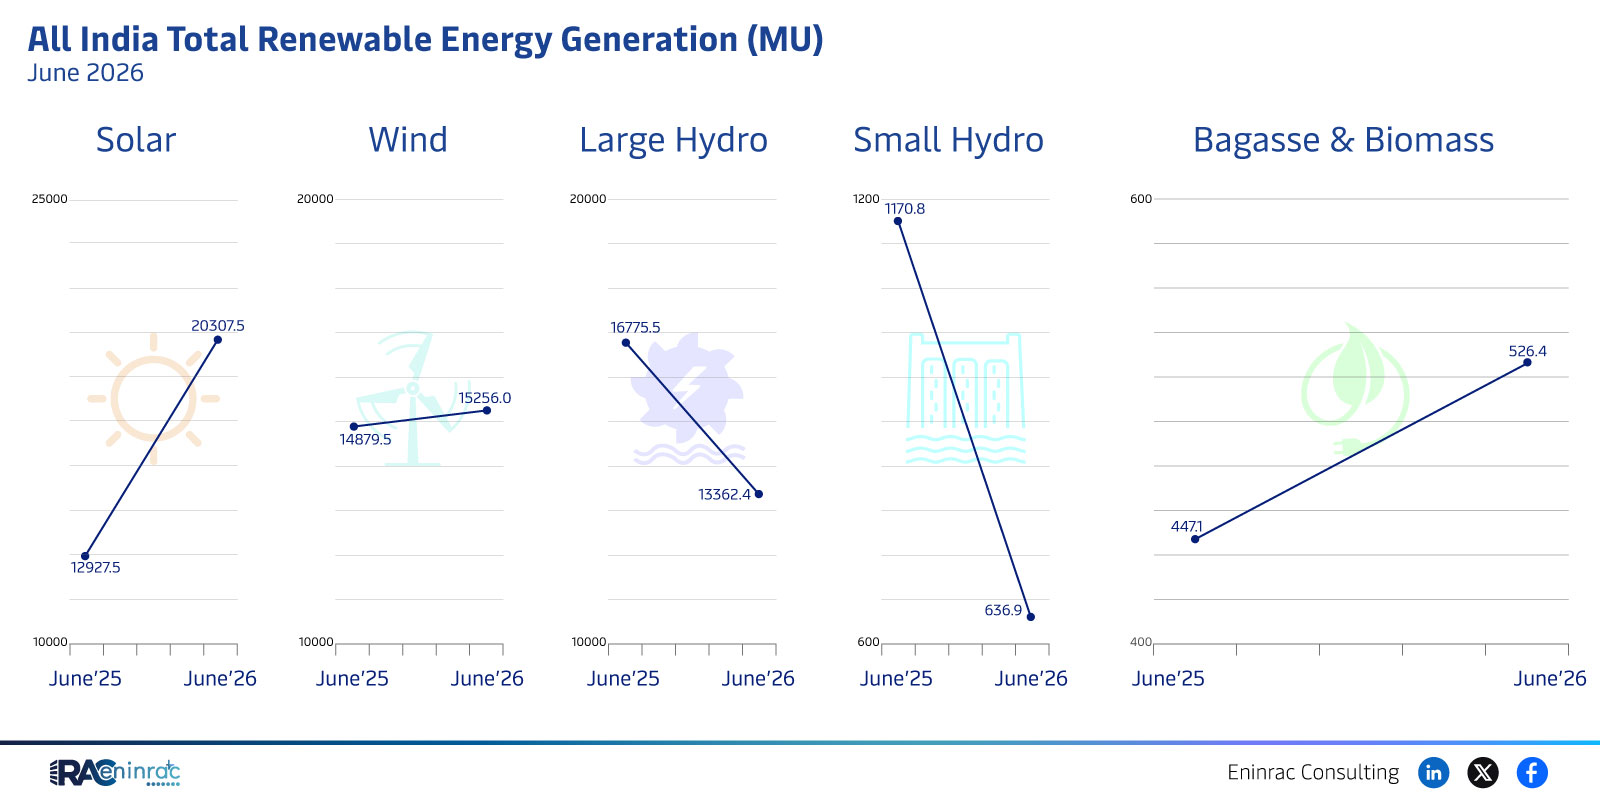
What does the June 2026 data show? The figures indicate that solar and wind each produced roughly 25,000 MU and 20,000 MU respectively, while large hydro matched wind at 20,000 MU. Small hydro contributed a modest 200 MU and biomass (bagasse & biomass) added about 708 MU. These results illustrate a diversified renewable portfolio with solar leading the surge.
Renewable Energy Generation Breakdown for June 2026
The comparative interpretation highlights that solar output outpaces all other sources, confirming its rapid deployment across Indian states. Wind and large hydro remain equally significant, each supplying close to 20,000 MU, suggesting strong offshore and reservoir projects. Small hydro’s limited share points to geographic constraints, while biomass reflects ongoing utilization of agricultural residues. Overall, the data underscores a shift toward high‑capacity solar farms complemented by mature wind and hydro infrastructure.
Impact on Sectors and Industries
This energy mix influences multiple sectors. Utilities benefit from a more balanced load, reducing reliance on coal. Equipment manufacturers see heightened demand for solar panels, wind turbines, and hydro turbines. Financial markets respond with increased renewable investment flows, and state governments can align policy incentives with observed performance. Consumers gain from cleaner electricity and potentially lower tariffs as renewable costs continue to fall.
Key Takeaways
- Solar generation leads with 25,000 MU in June 2026.
- Wind and large hydro each contribute around 20,000 MU.
- Small hydro remains a minor but stable source at 200 MU.
- Biomass adds just over 700 MU, reflecting niche usage.
- Diversified renewable mix supports grid stability and emission cuts.
- Data signals strong investment potential for solar and wind projects.
FAQs
Which renewable source contributed the most in June 2026?
Solar power generated the highest output, delivering approximately 25,000 MU.
How does wind generation compare to large hydro?
Both wind and large hydro produced similar volumes, each around 20,000 MU.
Is biomass a major part of India’s renewable mix?
Biomass contributed modestly, with about 708 MU, indicating a supplemental role.
What does the small hydro figure suggest?
Small hydro’s 200 MU highlights limited capacity but consistent regional contributions.
Why is this data important for investors?
It reveals sector growth trends, guiding capital allocation toward the fastest‑expanding renewable technologies.