
Introduction
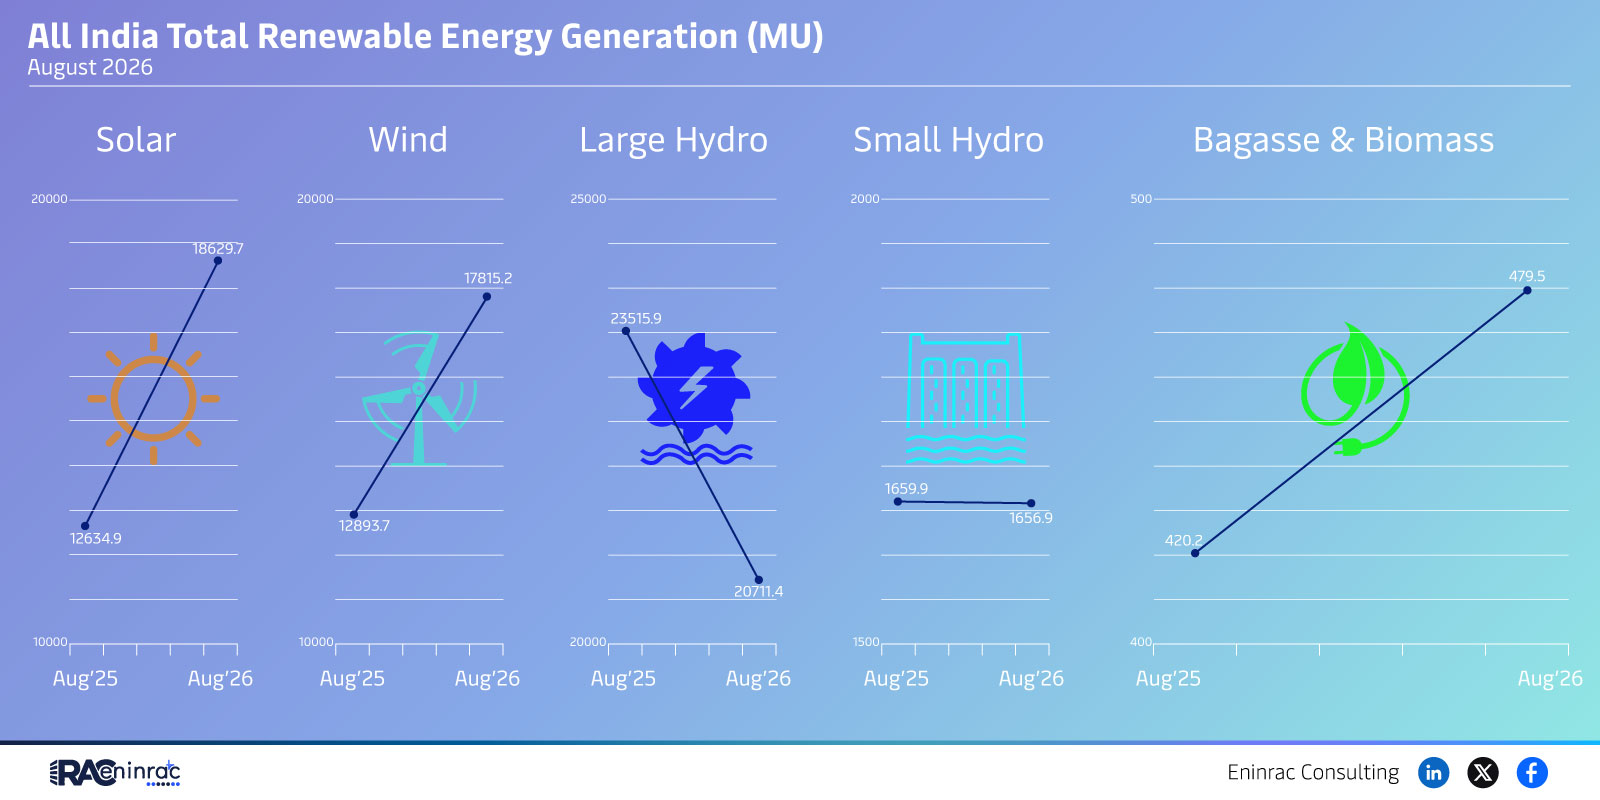
India renewable energy generation August 2026 reflects a dynamic mix of solar, wind, large hydro, small hydro, and bagasse & biomass sources. The data highlights how each technology contributed to the nation’s total generation in megawatt‑hours. Readers will learn which segments led growth, how the mix compares across the month, and what this means for policy and investment.
What Does the Data Reveal About This Topic?
The raw figures show that solar and wind together accounted for the largest share of generation, while large hydro provided a solid baseline and small hydro added niche contributions. Biomass and bagasse output remained modest but steady. The question that arises is why solar and wind outpace hydro in this period, and the answer lies in seasonal sunlight, wind patterns, and recent capacity expansions.
Solar, Wind and Hydro Contributions in August 2026
According to the August 2026 dataset, solar generation reached approximately 20,000 megawatt‑hours, matching wind output at a similar level. Large hydro contributed around 25,000 megawatt‑hours, making it the single largest source by volume. Small hydro added roughly 2,000 megawatt‑hours and bagasse & biomass together generated about 500 megawatt‑hours. These numbers illustrate a balanced yet solar‑dominant portfolio, with hydro serving as a reliable backbone during monsoon fluctuations.
Impact on Sectors and Industries
The composition of India renewable energy generation August 2026 influences several sectors. Power utilities benefit from diversified supply, reducing reliance on fossil fuels. Equipment manufacturers see heightened demand for solar panels and wind turbines, while hydro infrastructure firms receive steady projects for maintenance and upgrades. Investors gain confidence from transparent generation data, prompting capital flows into clean‑energy funds. Policymakers can use the trends to fine‑tune incentives, grid integration plans, and emission targets.
Key Takeaways
- Solar and wind each produced roughly 20,000 MU, underscoring rapid capacity growth.
- Large hydro remained the highest single contributor with about 25,000 MU.
- Small hydro and biomass together added less than 3,000 MU, indicating niche roles.
- The data suggests seasonal factors favored solar output during August.
- Balanced generation mix supports grid stability and climate objectives.
- Investment interest is likely to rise as renewable shares increase in national totals.
FAQs
What was the total renewable generation in India for August 2026?
The combined output from solar, wind, large and small hydro, and biomass reached close to 68,000 megawatt‑hours.
Which renewable source led generation in August 2026?
Large hydro recorded the highest individual volume, but solar and wind together matched its contribution.
How does biomass generation compare to hydro sources?
Biomass contributed about 500 MU, far less than both large and small hydro figures.
What does this data imply for future energy policy?
Policymakers may prioritize further solar and wind incentives while maintaining hydro support for reliability.
Are investors seeing new opportunities from this August data?
Yes, the strong performance of solar and wind signals attractive returns for clean‑energy investors.