
Introduction
India power generation 2026 data highlights the performance of thermal and nuclear plants across the country in June 2026. Understanding these figures matters because they indicate how well India is meeting its electricity demand, the progress toward its generation targets, and the regional balance of energy supply. This article explains the total capacity versus actual generation, breaks down regional contributions, and discusses the implications for investors, policymakers, and industry stakeholders.
What Does the Data Reveal About This Topic?
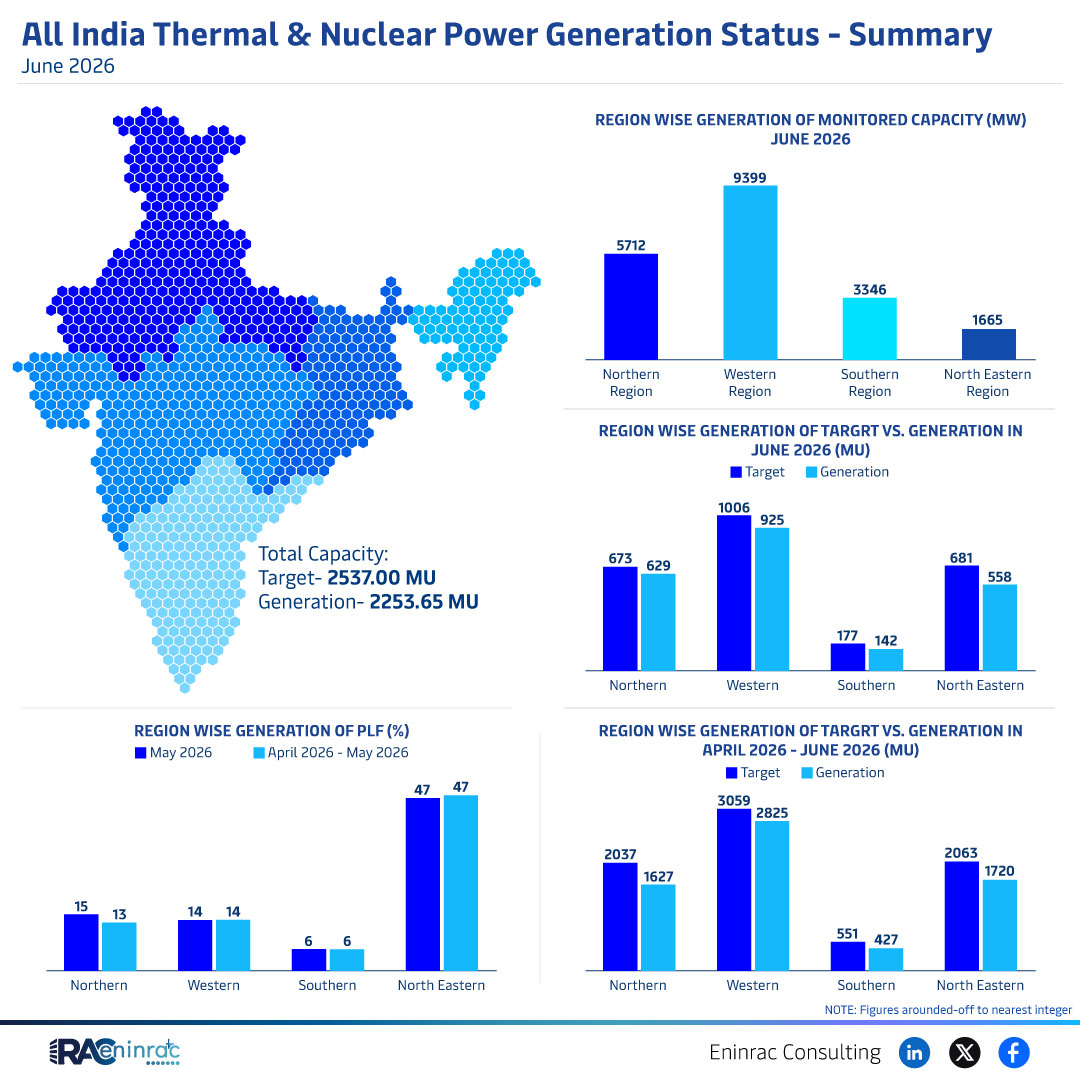
The primary insight from the June 2026 snapshot is that India generated 2,253.65 MU of electricity, falling short of the 2,537.00 MU target. This gap suggests that thermal and nuclear assets are operating below optimal levels, possibly due to maintenance, fuel constraints, or policy factors. By comparing the target with actual output, readers can gauge the reliability of conventional energy sources and identify areas needing improvement.
Regional Performance Overview
When the data is divided by region, the Northern zone emerges as the leading contributor with 673 MU generated, followed closely by the Western region at 629 MU. The Southern and North‑Eastern zones lag behind, producing 307 MU and 254 MU respectively. Monitored capacity also varies, with the North reporting the highest installed capacity of 9,399 MW, while the South and North‑East hold 1,665 MW and 3,346 MW. These disparities underline the uneven development of thermal and nuclear infrastructure and point to where future capacity expansions may be most needed.
Impact on Sectors and Industries
These generation figures influence multiple sectors. Power‑intensive industries such as steel, cement, and chemicals rely on stable conventional supply, and shortfalls can raise operating costs. Investors watch the gap between target and actual generation to assess the risk profile of thermal and nuclear projects. Policymakers use the regional gaps to prioritize grid upgrades, fuel logistics, and incentives for capacity addition. Consumers may experience price adjustments if conventional supply constraints persist, reinforcing the importance of balancing generation with demand.
Key Takeaways
- India generated 2,253.65 MU in June 2026, below the 2,537 MU target.
- Northern region leads with the highest generation and capacity.
- Western region follows closely, while Southern and North‑Eastern zones lag.
- Monitored capacity totals differ markedly across regions, highlighting infrastructure gaps.
- Shortfalls affect industrial costs, investor confidence, and policy priorities.
- Future investments should focus on under‑served regions to meet national energy goals.
FAQs
What was the total electricity generation in India for June 2026?
India generated approximately 2,254 MU of electricity in June 2026.
How does actual generation compare to the target?
The actual generation was about 283 MU below the 2,537 MU target.
Which region produced the most power?
The Northern region produced the highest amount of power in June 2026.
Why is there a gap between target and actual generation?
Factors include plant maintenance, fuel supply issues, and operational constraints.
What are the implications for investors?
Investors may see higher risk in conventional projects and may look for opportunities in under‑served regions.