
Introduction
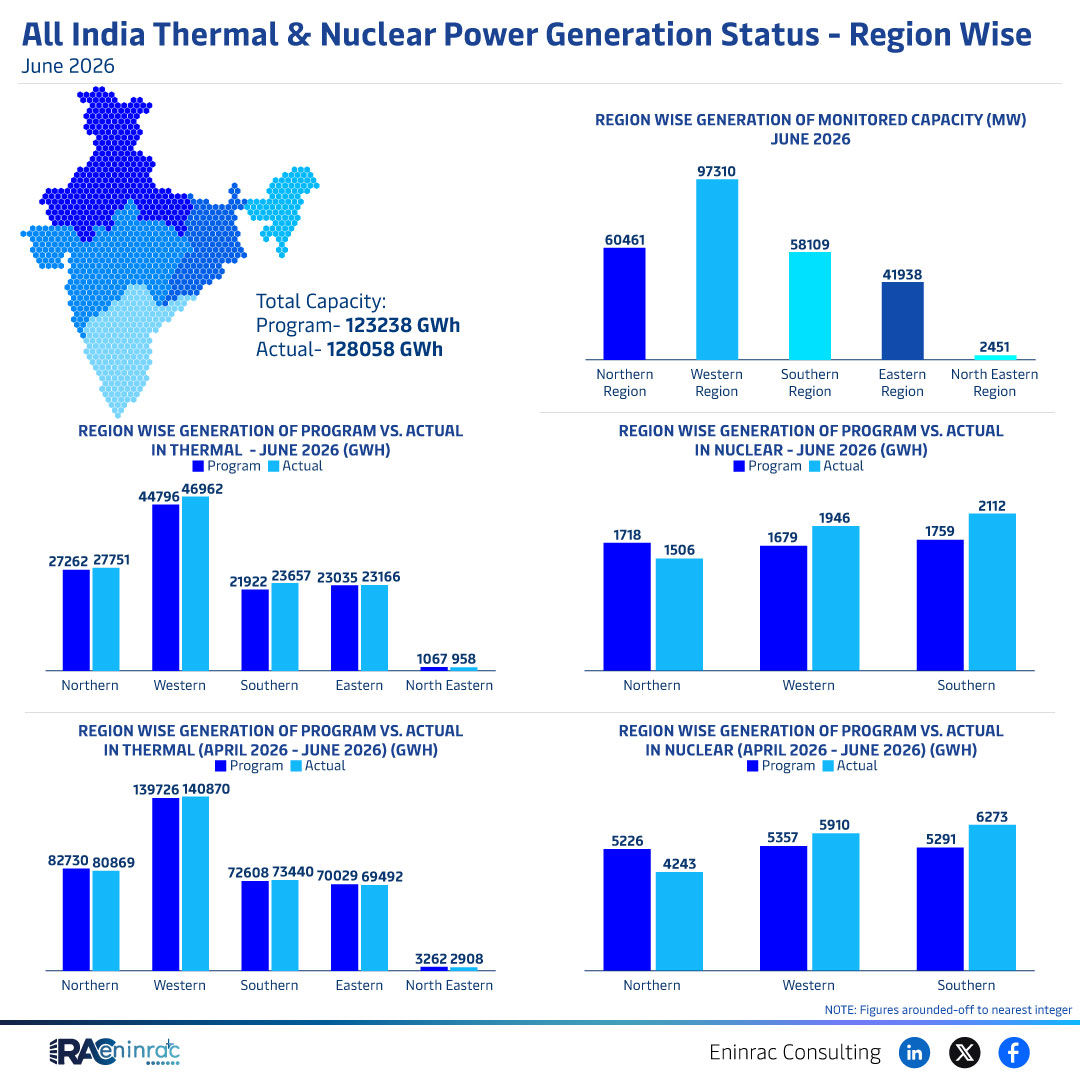
India’s power landscape in June 2026 is captured through detailed thermal and nuclear generation statistics broken down by region. The data shows how program targets compare with actual output, the capacity that is monitored, and the regional disparities that influence national energy security. Readers will discover the performance of the North, West, South, East and North‑East zones, understand the balance between conventional thermal plants and nuclear facilities, and gain insights useful for investors, policymakers and industry analysts.
What Does the Data Reveal About This Topic?
Does the June 2026 report indicate that India is meeting its power generation goals? The answer is mixed. While overall actual generation (128,058 GWh) exceeds the program estimate (123,238 GWh), certain regions lag behind their targets, especially in the nuclear segment where actual output falls short of programmed forecasts. The thermal sector generally outperforms expectations, highlighting the resilience of coal‑based and gas‑fired assets across most regions.
Regional Performance of Thermal and Nuclear Power in June 2026
The northern region leads thermal generation with a program of 44,796 GWh and an actual of 46,962 GWh, followed closely by the western and southern zones. In contrast, the eastern and north‑eastern regions show smaller contributions, reflecting lower plant density. Nuclear generation remains modest, with the north reporting 1,946 GWh program versus 1,718 GWh actual, while the western and southern zones hover around 1,600 GWh. Monitored capacity data indicates a total of 97,310 MW across all regions, reinforcing the dominance of conventional energy sources in India’s current mix.
Impact on Sectors and Industries
These generation patterns affect multiple stakeholders. Investors can spot regions with capacity gaps that may attract new projects, while utilities assess the reliability of existing thermal assets versus nuclear expansion plans. Policymakers receive evidence to calibrate subsidy schemes, grid integration strategies, and emissions targets. For manufacturers of power equipment, the strong thermal performance suggests continued demand for turbines and fuel handling systems, whereas the modest nuclear growth points to niche opportunities in reactor technology and safety services.
Key Takeaways
- India’s total power generation in June 2026 surpasses program estimates.
- Thermal plants exceed targets in most regions, especially the North.
- Nuclear output falls short of programmed levels across all zones.
- Monitored capacity stands at 97,310 MW, underscoring reliance on conventional energy.
- Regional imbalances highlight growth opportunities in the East and North‑East.
- Data provides actionable insight for investors, policymakers and energy firms.
FAQs
What was the total actual power generation in India for June 2026?
The actual generation reached 128,058 GWh, exceeding the program target of 123,238 GWh.
Which region contributed the most thermal power?
The northern region led with 46,962 GWh of actual thermal generation.
Did any nuclear region meet its program target?
No. All nuclear regions recorded actual output lower than the programmed figures.
How much monitored capacity is reported?
The report lists a total monitored capacity of 97,310 MW across India.
Why is this data important for investors?
It highlights where generation gaps exist, indicating where new capacity investments could yield the highest returns.