
Introduction
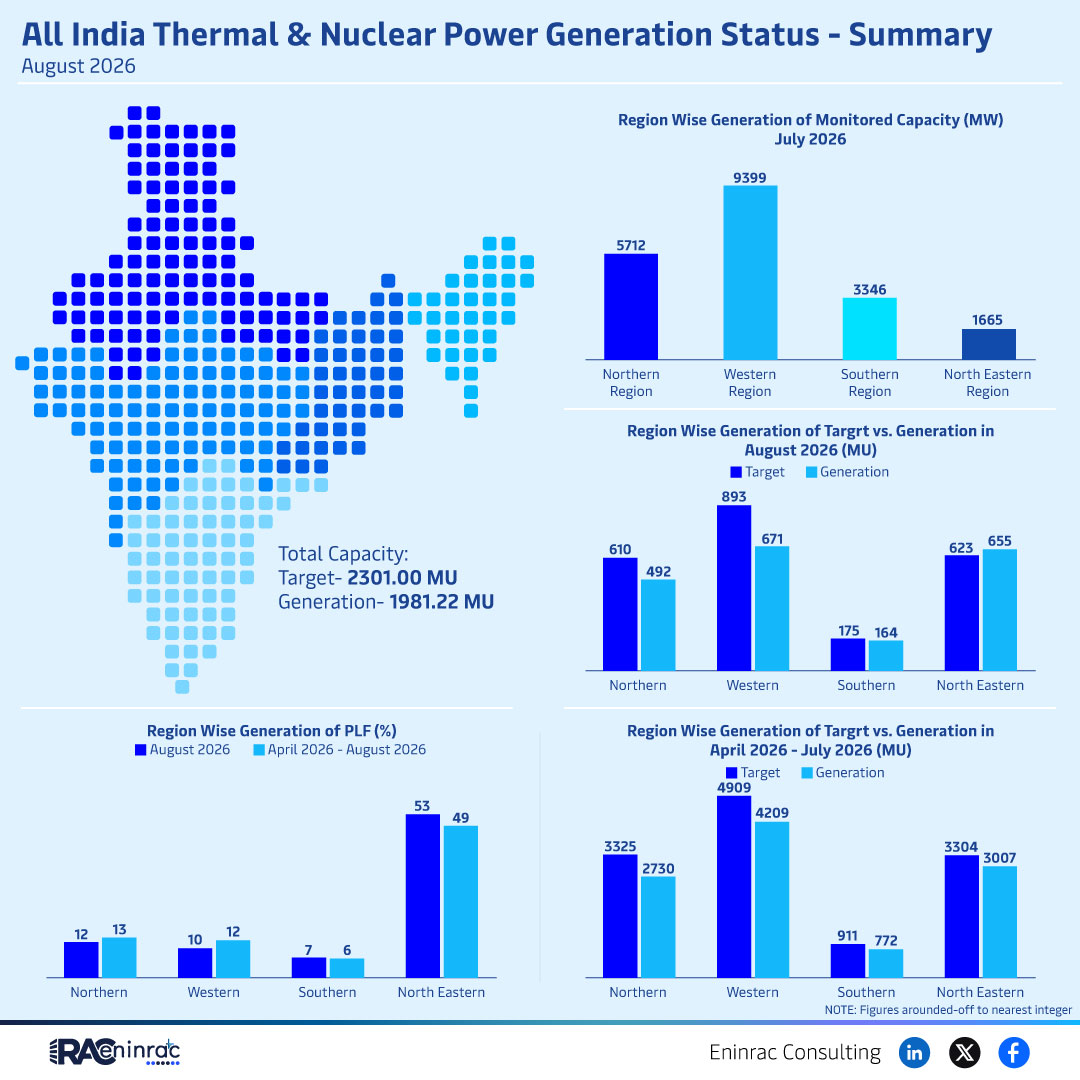
India’s power sector continues to be a cornerstone of the nation’s economic growth, especially the thermal and nuclear segments that together meet a substantial share of electricity demand. The August 2026 snapshot provides a clear picture of how much capacity is operational, how much electricity has been generated, and how regional outputs compare to national targets. Readers will learn about the overall generation performance, regional disparities, and the implications for policymakers, investors, and industry stakeholders.
What Does the Data Reveal About This Topic?
The core insight from the August 2026 data is that India thermal and nuclear power generation reached 1,981.22 million units (MU) against a projected target of 2,301 MU, indicating a shortfall of roughly 320 MU. This gap highlights capacity utilization challenges and underscores the importance of regional contributions, with northern regions delivering the highest output while eastern and southern zones lag behind.
Regional Performance Highlights for August 2026
When broken down by geography, the northern region topped the chart with the largest generation volume, followed by the western, southern, and north‑eastern regions. Monitored capacity figures for July 2026 show the north at 9,399 MW, the west at 5,712 MW, the south at 3,346 MW, and the north‑east at 1,665 MW. The target versus actual comparison for August indicates the north aimed for 175 MU and delivered 164 MU, the west targeted 164 MU and achieved 151 MU, while the south and north‑east fell further short of their goals. These variations point to differing operational efficiencies, fuel availability, and maintenance schedules across zones.
Impact on Sectors and Industries
The shortfall in meeting generation targets can affect several downstream sectors. Industrial manufacturers reliant on steady power supplies may face higher operating costs or production delays. Investors in conventional projects might reassess risk models, while policymakers could prioritize grid upgrades, fuel logistics, and incentives for higher capacity utilization. Additionally, the data provides a benchmark for comparing renewable integration progress and informs decisions on future capacity expansion in the conventional energy mix.
Key Takeaways
- India generated 1,981.22 MU of thermal and nuclear power in August 2026, below the 2,301 MU target.
- Northern region contributed the highest generation and capacity, leading national totals.
- Western and southern regions showed moderate performance, while north‑eastern output remained the lowest.
- Capacity utilization gaps suggest operational bottlenecks that need strategic interventions.
- Shortfalls may increase pressure on industrial consumers and influence investment decisions.
- Policymakers can use the data to refine energy policies, improve grid reliability, and balance conventional with renewable sources.
FAQs
What was the total electricity generation from thermal and nuclear sources in India for August 2026?
The total generation was 1,981.22 million units (MU).
How does the actual generation compare to the target set for August 2026?
Generation fell short of the target by about 320 MU, achieving roughly 86% of the goal.
Which region produced the most power in August 2026?
The northern region led with the highest generation and monitored capacity.
What are the implications of the generation shortfall for investors?
Investors may view the shortfall as a risk indicator and may seek opportunities to improve plant efficiency or support policy reforms.
How can policymakers address the capacity utilization gap?
Strategies include enhancing fuel supply chains, upgrading plant technology, incentivizing better operational practices, and integrating more flexible renewable resources.