
Introduction
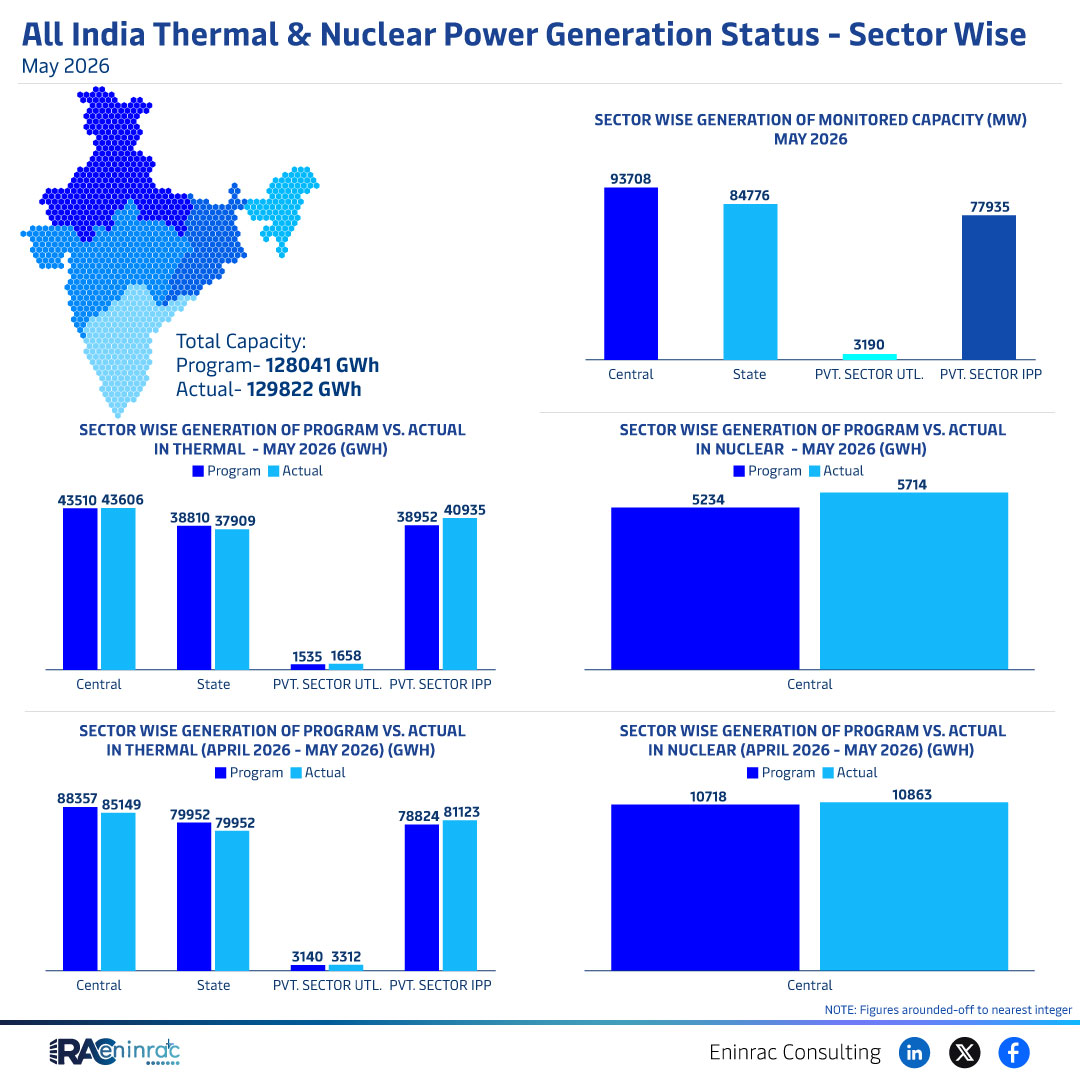
The latest month‑wise report from Eninrac Consulting shows India’s total electricity generation for May 2026, covering both thermal and nuclear sources. With a programmed capacity of 128 041 GWh and an actual output of 129 822 GWh, the nation slightly exceeded its forecast. The data is broken down by sector – central, state, private and independent power producers (IPPs) – and includes monitored capacity figures in megawatts. Understanding these numbers helps policymakers, investors, and industry analysts assess the performance of conventional energy assets, gauge grid reliability, and plan future capacity expansions. This article interprets the May 2026 figures, highlights key trends, and discusses their implications for India’s energy landscape.
What Does the Data Reveal About This Topic?
What does the data reveal about India’s power generation mix in May 2026? The figures indicate that thermal plants delivered 43 606 GWh, just 96 GWh above the programmed 43 510 GWh, showing a marginal over‑performance. Nuclear output registered 38 952 GWh actual against a program of 38 810 GWh, also slightly higher. Combined, the actual generation of 82 558 GWh (thermal + nuclear) surpassed the programmed 82 320 GWh, confirming that conventional sources remain the backbone of the national grid. The capacity monitoring table shows a total of 93 708 MW of operational capacity, with central utilities accounting for the largest share, followed by state and private sectors.
Thermal vs Nuclear Generation Performance in May 2026
When comparing thermal and nuclear performance, thermal generation still dominates the overall energy mix, contributing roughly 53 % of total conventional output, while nuclear accounts for about 47 %. The thermal sector’s slight excess over the program reflects stable fuel supply and effective plant dispatch. Nuclear’s modest gain suggests efficient load‑following and successful maintenance scheduling. Regional capacity data shows central utilities leading in both sectors, but state‑run entities hold a larger proportion of thermal capacity, whereas private and IPP players are more represented in nuclear installations. These patterns underscore the complementary role of nuclear power in supporting base‑load requirements while thermal plants provide flexibility during peak demand periods.
Impact on Sectors and Industries
The May 2026 generation results have several implications for related sectors. For investors, the consistent over‑achievement of programmed output signals reliability of conventional assets, encouraging continued funding in both thermal upgrades and nuclear projects. Policymakers can use the data to justify incentives for capacity expansion, especially in regions where monitored capacity lags behind demand. Utilities benefit from the clear performance benchmarks to optimize dispatch and fuel procurement strategies. Meanwhile, equipment manufacturers and service providers gain insight into potential maintenance cycles and upgrade windows, while consumers can expect a stable supply as conventional sources continue to meet the majority of electricity needs.
Key Takeaways
- India’s actual generation of 129 822 GWh in May 2026 exceeded the program by 1 781 GWh.
- Thermal output reached 43 606 GWh, marginally higher than the forecasted 43 510 GWh.
- Nuclear generation posted 38 952 GWh, surpassing the programmed 38 810 GWh.
- Total monitored capacity stood at 93 708 MW, with central utilities leading the share.
- Thermal plants supplied roughly 53 % of conventional generation, nuclear about 47 %.
- Consistent over‑performance reinforces confidence in India’s conventional energy infrastructure.
FAQs
What was the total electricity generation in India for May 2026?
The country generated 129 822 GWh of electricity in May 2026, slightly above the programmed target.
How did thermal power perform compared to its program?
Thermal power produced 43 606 GWh, surpassing the programmed 43 510 GWh by 96 GWh.
Did nuclear generation meet its forecast?
Yes, nuclear output was 38 952 GWh against a program of 38 810 GWh, showing a small excess.
Which sector holds the largest monitored capacity?
Central utilities hold the largest share of monitored capacity, followed by state and private sectors.
What does this data mean for future energy investments?
The over‑achievement signals reliability of conventional assets, encouraging continued investment in both thermal upgrades and nuclear projects.