
Introduction
India’s electricity landscape in June 2026 showcases the performance of both thermal and nuclear power plants across the nation. The data released by Eninrac Consulting provides a detailed view of program targets versus actual generation, monitored capacity, and regional contributions. Understanding these figures is essential for policymakers, investors, and industry analysts who track energy security, demand‑supply balance, and the effectiveness of government programmes. This article breaks down the numbers, highlights key trends, and explains what the results mean for the broader Indian power sector.
What Does the Data Reveal About This Topic?
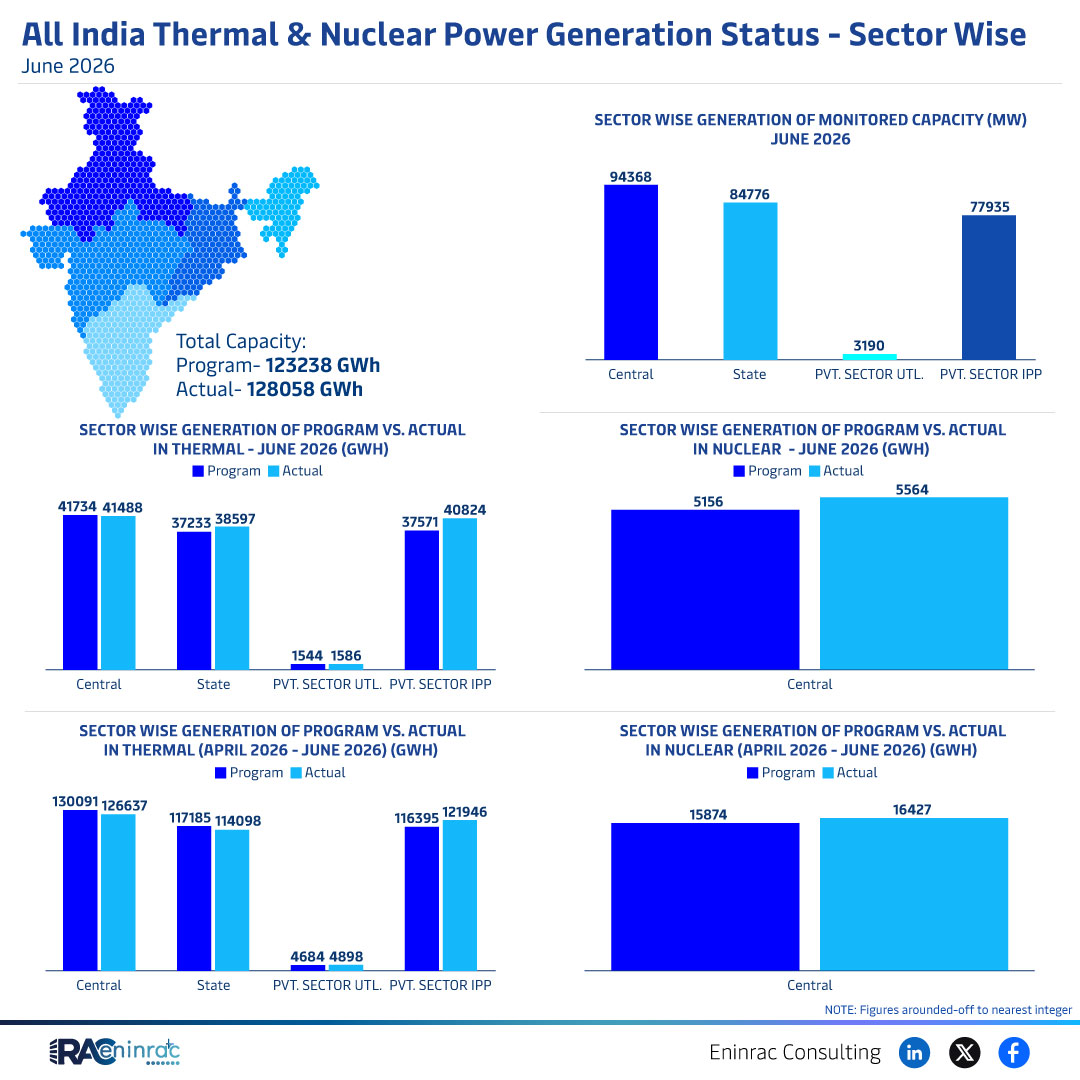
Does the June 2026 generation data indicate that India met its power generation goals? The answer is mixed. While total actual generation reached 128,058 GWh, surpassing the program target of 123,238 GWh, the thermal sector fell slightly short of its own program values, and nuclear generation showed a modest shortfall. The data also shows variations across central, state, and private entities, reflecting differing operational efficiencies and capacity utilisation rates.
June 2026 Generation by Sector and Region
Thermal generation in June 2026 amounted to 41,734 GWh (program) versus 41,488 GWh (actual) in one dataset, with other entries showing 37,233 GWh program against 38,537 GWh actual, and 1,544 GWh program against 1,586 GWh actual. Monitored capacity totals 94,368 MW, with central utilities contributing the largest share, followed by state and private sector participants. Nuclear output recorded 5,564 GWh program versus 5,156 GWh actual, indicating a small gap between expectations and real performance. Over the April‑June quarter, cumulative thermal generation was 130,091 GWh program compared with 126,637 GWh actual, while nuclear produced 117,185 GWh program versus 114,098 GWh actual, underscoring consistent trends of slight under‑achievement in nuclear and marginal over‑achievement in some thermal batches.
Impact on Sectors and Industries
The observed generation patterns influence multiple stakeholders. For conventional energy investors, the closeness of actual figures to program targets suggests stable revenue expectations but also highlights the need for efficiency improvements in thermal plants. Policymakers can use the shortfall in nuclear output to reassess fuel supply chains, regulatory approvals, and capital allocation for new reactors. Businesses dependent on reliable electricity—such as manufacturing and IT services—must monitor these trends to anticipate potential supply constraints. Moreover, the data supports climate‑related policy discussions by illustrating the continued dominance of fossil‑fuel‑based thermal power even as nuclear contributions remain modest.
Key Takeaways
- Overall electricity generation in June 2026 exceeded the program target by about 5,000 GWh.
- Thermal power showed both under‑performance and over‑performance across different datasets, indicating operational variability.
- Nuclear generation consistently fell short of its program, highlighting capacity and perhaps fuel challenges.
- Central utilities dominate monitored capacity, followed by state and private sector participants.
- The April‑June quarter reflects a slight decline in cumulative actual generation compared with program forecasts for both thermal and nuclear.
- Stakeholders should focus on improving thermal plant efficiency and addressing nuclear shortfalls to meet future energy security goals.
FAQs
Did India meet its overall power generation target in June 2026?
Yes, the total actual generation of 128,058 GWh surpassed the program target of 123,238 GWh.
Which sector showed the biggest gap between program and actual output?
Nuclear power had the most noticeable shortfall, with actual generation 5,156 GWh versus a program of 5,564 GWh.
What is the monitored capacity for thermal power?
Monitored capacity for thermal power stands at 94,368 MW, distributed among central, state, and private entities.
How does the April‑June 2026 performance compare to the program?
Both thermal and nuclear sectors generated slightly less than programmed, with thermal at 126,637 GWh actual versus 130,091 GWh program, and nuclear at 114,098 GWh actual versus 117,185 GWh program.
What implications does this data have for energy investors?
Investors can view the near‑target performance as a sign of sector stability but should consider the efficiency gaps in thermal plants and the under‑performance of nuclear when planning future investments.