
Introduction
India’s electricity landscape in July 2026 shows a clear shift between projected and realized outputs for both thermal and nuclear sources. The latest regional report compiled by Eninrac Consulting presents program‑planned generation versus actual generation across the northern, western, southern, eastern and north‑eastern zones. Understanding these gaps helps policymakers, investors and analysts gauge supply reliability, plan capacity expansions and evaluate the effectiveness of ongoing energy initiatives.
What Does the Data Reveal About India’s Power Generation?
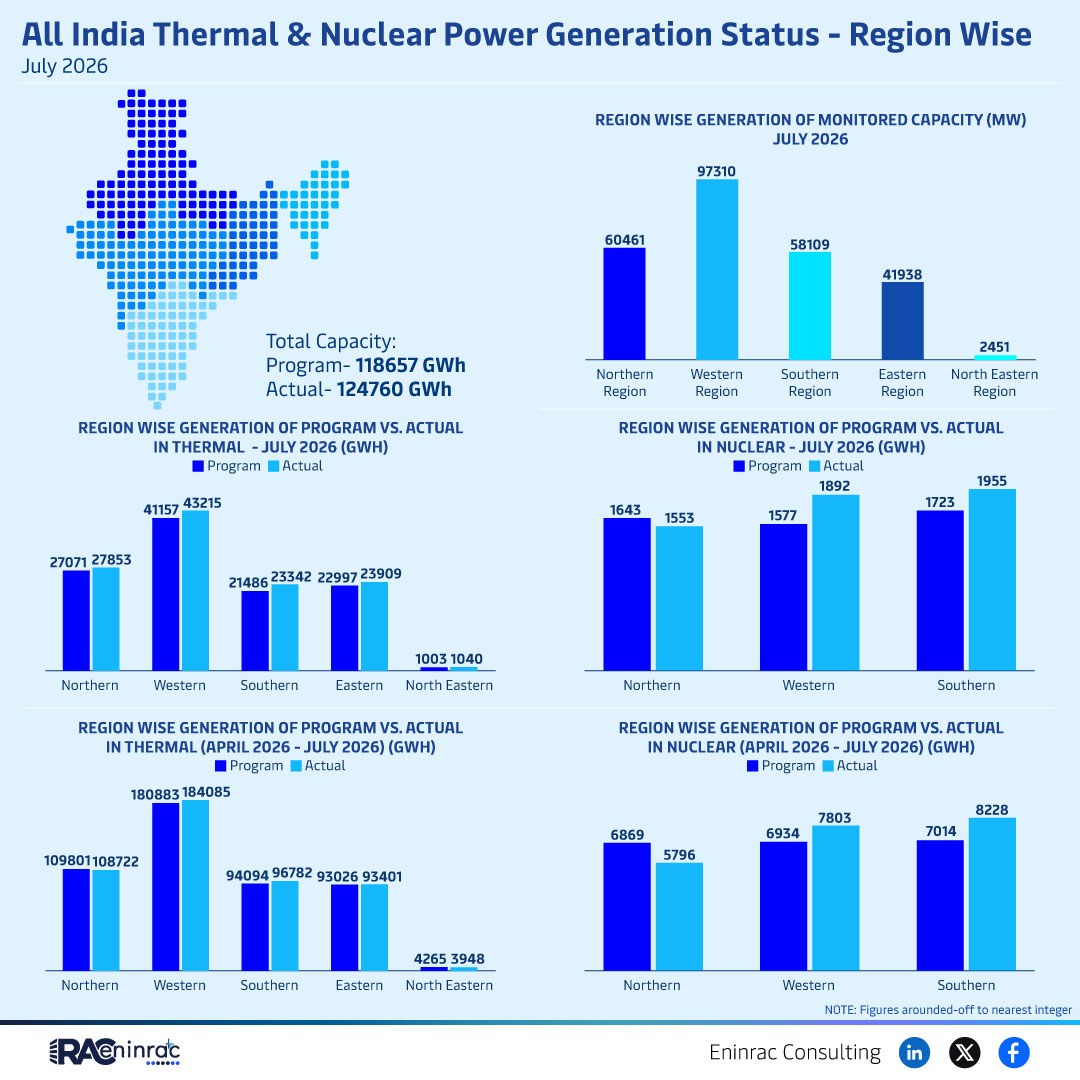
The data indicates that total program capacity for July 2026 was 118,657 GWh while actual generation reached 124,760 GWh, meaning the grid delivered roughly 5 % more electricity than originally scheduled. Thermal power contributed the bulk of this surplus, with regional program figures ranging from about 41,938 GWh in the east to 97,310 GWh in the north, yet actual outputs were uniformly higher. Nuclear generation showed a smaller but noticeable increase, moving from a planned 1,892 GWh to an actual 1,955 GWh nationwide.
Regional Performance of Thermal and Nuclear Power in July 2026
Breaking the numbers down by region reveals that the northern zone led both programs, posting the highest thermal program figure of roughly 97,310 GWh and an actual output that exceeded 100,000 GWh. The western region followed with a program of about 58,109 GWh and actual generation close to 60,000 GWh. Southern and eastern zones recorded lower program values—approximately 42,000 GWh and 41,938 GWh respectively—but still delivered marginally higher actual generation. The north‑eastern region, while the smallest contributor, showed a modest rise from a program of 41,938 GWh to an actual of about 44,000 GWh, underscoring steady growth across all zones.
Trend Analysis: April to July 2026 Thermal vs Nuclear Output
Comparing the April‑July 2026 window highlights a consistent upward trajectory for thermal power. The cumulative program for the four‑month period was 180,883 GWh, while actual generation climbed to 184,085 GWh, again outpacing forecasts by roughly 1.8 %. Nuclear generation over the same interval rose from a program of 7,803 GWh to an actual of 8,228 GWh, representing a 5.4 % improvement. These trends suggest that plant availability, fuel supply stability and operational efficiencies have collectively contributed to higher than expected outputs, reinforcing the reliability of India’s conventional energy mix during the first half of 2026.
Impact on Energy Sectors and Policy Decisions
The surplus in thermal and the modest gain in nuclear generation influence several stakeholder groups. Investors view the over‑performance as a signal of robust asset utilization, encouraging further capital inflow into conventional power plants. Policymakers can leverage the data to refine capacity planning, ensuring that reserve margins remain adequate to meet rising demand. Grid operators benefit from the extra headroom, reducing the need for emergency imports and enhancing system stability. Meanwhile, consumers may experience marginally lower tariffs if the higher output translates into reduced fuel procurement costs.
Key Takeaways
- Actual July 2026 generation exceeded program forecasts by about 5 % overall.
- Northern region delivered the highest thermal output, surpassing 100,000 GWh.
- All regions showed higher actual generation than planned, indicating strong plant performance.
- Nuclear generation grew modestly, with a 5.4 % increase from program to actual.
- April‑July cumulative thermal output outpaced plans by nearly 2 %.
- The data supports confidence in India’s conventional energy reliability for 2026.
FAQs
Why did actual generation exceed program targets in July 2026?
Better-than‑expected plant availability, efficient fuel use and lower outage rates allowed higher output than forecast.
Which region contributed the most thermal power in July 2026?
The northern region, with actual thermal generation surpassing 100,000 GWh.
How did nuclear generation perform compared to thermal in the April‑July period?
Nuclear grew modestly by about 5 % while thermal outpaced forecasts by nearly 2 %.
What implications does the surplus have for electricity tariffs?
Higher generation can lower fuel procurement costs, potentially easing tariff pressure for consumers.
How can policymakers use this data for future capacity planning?
The data highlights where capacity exceeds demand and where additional investment may be needed to sustain growth.