
Introduction
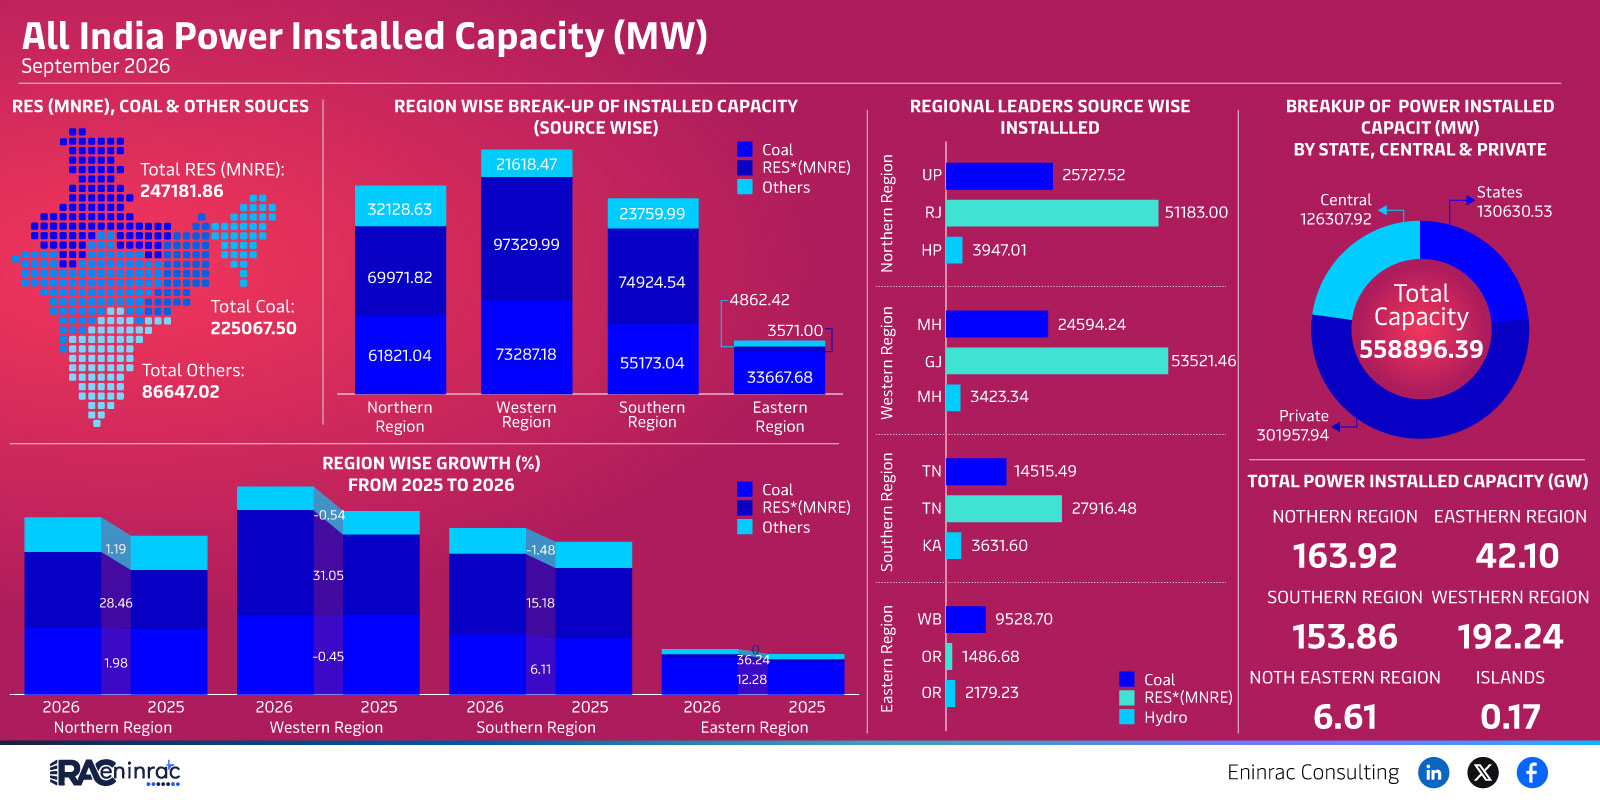
India's power landscape in September 2026 presents a detailed picture of installed capacity across renewable, coal and other sources. Understanding this mix is essential for investors, policymakers and industry observers who track the nation’s energy transition. This article breaks down the total capacity, highlights regional disparities, and explains what the numbers mean for the future of Indian electricity supply.
What Does the Data Reveal About This Topic?
The data shows that total installed capacity reached 558,896.39 MW, with renewable energy (as reported by MNRE) contributing 247,181.86 MW, coal 225,067.50 MW, and other sources 86,647.02 MW. In simple terms, renewables now account for roughly 44 % of India’s power capacity, while coal remains a close second at about 40 %. This balance raises the question: how is the shift toward cleaner energy influencing regional performance and investment decisions?
Regional Power Capacity Landscape in September 2026
When capacity is viewed by region, the western zone leads with 192.24 GW, followed by the northern region at 163.92 GW. The southern region holds 153.86 GW and the eastern region trails with 42.10 GW. Island territories together add just 6.78 GW. These figures indicate that western states are accelerating renewable installations, while the east lags behind, relying more on coal and traditional plants. State‑level snapshots such as Rajasthan's 51,183 MW and Gujarat's 53,521 MW further underline the uneven rollout of new projects across the country.
Impact on Sectors and Industries
The evolving capacity mix influences multiple sectors. Power generators must adapt to higher renewable penetration, prompting investments in grid flexibility and storage. Equipment manufacturers see rising demand for solar panels, wind turbines and battery systems. Financial markets are reassessing risk profiles of coal‑heavy utilities, while green bonds and ESG funds gain traction. Policymakers are compelled to design incentives that sustain growth in under‑served eastern regions and ensure reliable supply during the transition.
Key Takeaways
- Renewable energy accounts for roughly 44 % of total capacity in 2026.
- Coal remains a major contributor at about 40 % of installed capacity.
- Western India leads with the highest regional capacity at 192.24 GW.
- Eastern India shows the lowest capacity, highlighting a regional development gap.
- State‑level data reveals Rajasthan and Gujarat as top contributors.
- The shift affects investors, grid operators and equipment manufacturers alike.
FAQs
What is the total power installed capacity in India for 2026?
India’s total installed capacity reached approximately 558,896 MW (or 558.9 GW) in September 2026.
How much renewable capacity does India have in 2026?
Renewable sources contributed about 247,182 MW, representing roughly 44 % of the nation’s total capacity.
Which region has the highest installed capacity?
The western region leads with 192.24 GW, making it the largest contributor to India’s power infrastructure.
Is coal’s share of capacity decreasing?
Coal still holds a significant share at 225,068 MW (around 40 %). While its proportion has slightly declined, it remains a key part of the energy mix.
What does this data mean for renewable investors?
The strong renewable share and regional growth, especially in the west, signal attractive investment opportunities in solar, wind and storage technologies.