
Introduction
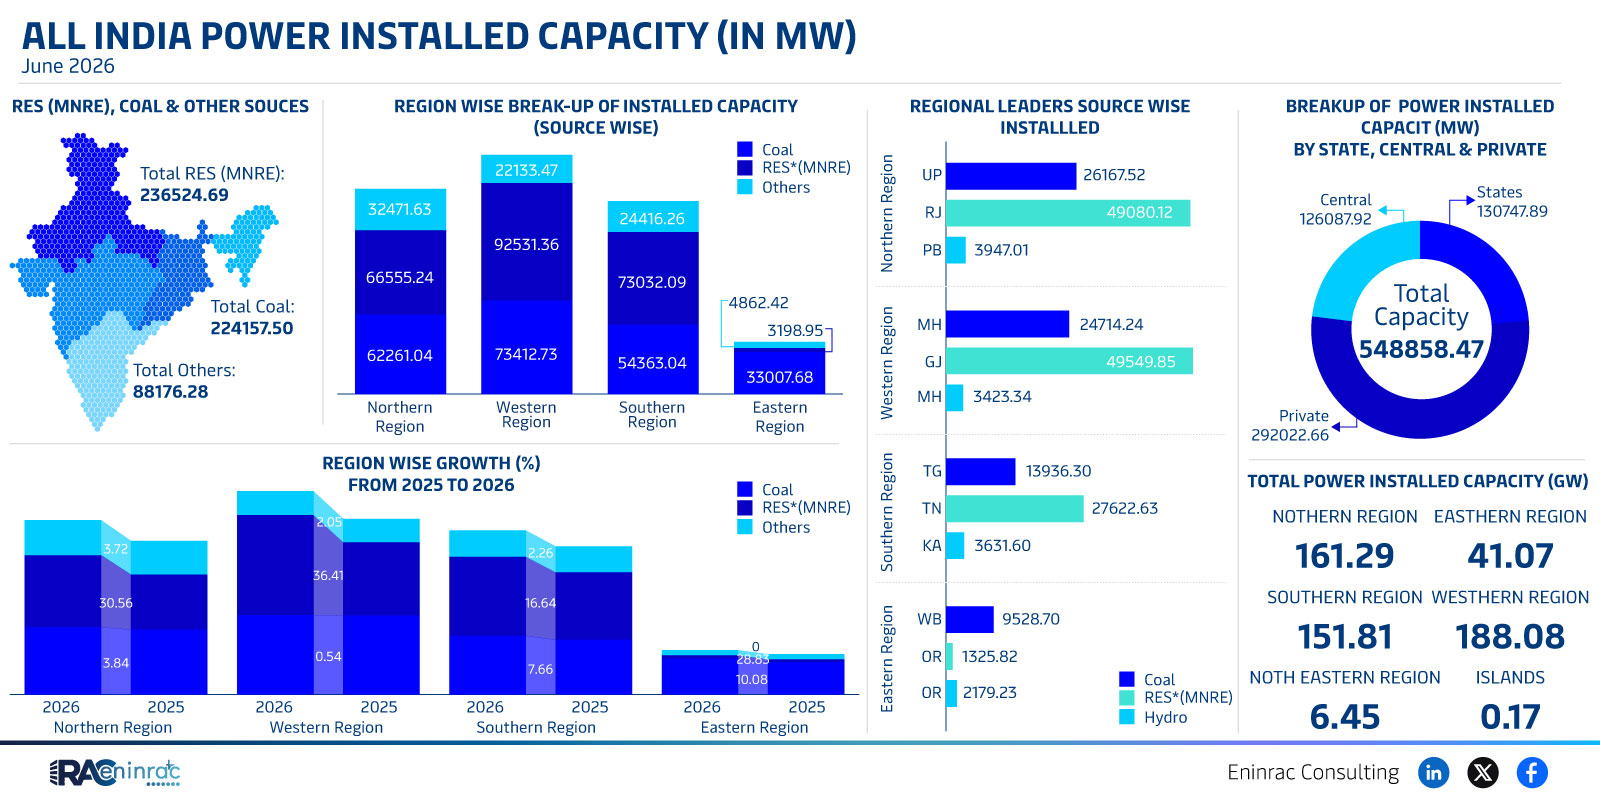
June 2026 data reveals the scale of India’s electricity infrastructure, showing a total installed capacity of 548,858 MW. This figure combines renewable sources, coal‑based plants and other generation types. Understanding the regional distribution, the split between public and private ownership, and the balance of renewable versus conventional sources helps investors, policymakers and analysts gauge the country’s energy trajectory.
What Does the Data Reveal About This Topic?
The most striking insight is that renewable energy (RES) contributed 236,525 MW, while coal‑based generation provided 224,158 MW. Private sector capacity accounts for 292,023 MW, indicating strong commercial participation. Regionally, the Western zone leads with 188 GW, followed closely by the Southern zone at 152 GW, highlighting geographic hotspots for new projects.
Regional Capacity Comparison
When broken down by region, the Northern area holds 161 GW, the Eastern region 41 GW, and the North‑Eastern islands contribute roughly 14 GW. The Western region’s 188 GW dominance reflects abundant solar and wind potential, whereas the Southern region’s 152 GW is driven by a mix of thermal, solar and hydro assets. State‑level leaders such as Uttar Pradesh, Rajasthan and Maharashtra together account for a sizeable share of capacity, underscoring their strategic importance.
Impact on Sectors and Industries
These capacity figures influence multiple sectors. A higher share of renewables reduces reliance on imported coal, supporting energy security and climate goals. Private investors see opportunities in solar, wind and hybrid projects, while traditional utilities must adapt to a changing generation mix. Policymakers can target grid upgrades in high‑growth regions, and manufacturers of turbines and PV modules benefit from the expanding demand.
Key Takeaways
- India’s total installed capacity reached 548,858 MW in June 2026.
- Renewable energy contributed 236,525 MW, narrowing the gap with coal.
- Private sector capacity stands at 292,023 MW, highlighting robust commercial involvement.
- The Western region leads with 188 GW, driven by solar and wind projects.
- The Southern region follows with 152 GW, displaying a balanced energy mix.
- Regional growth trends point to continued investment in the West and South for the next decade.
FAQs
What is the total installed power capacity in India as of June 2026?
It is 548,858 MW, combining renewable, coal and other generation sources.
How much capacity does renewable energy provide?
Renewable sources account for approximately 236,525 MW of the total capacity.
Which region has the highest installed capacity?
The Western region leads with about 188 GW of installed capacity.
What share of capacity is owned by the private sector?
Private entities own roughly 292,023 MW, representing over 53% of the total.
How does coal capacity compare to renewables?
Coal‑based capacity stands at 224,158 MW, slightly below renewable capacity, indicating a narrowing gap.