
Introduction
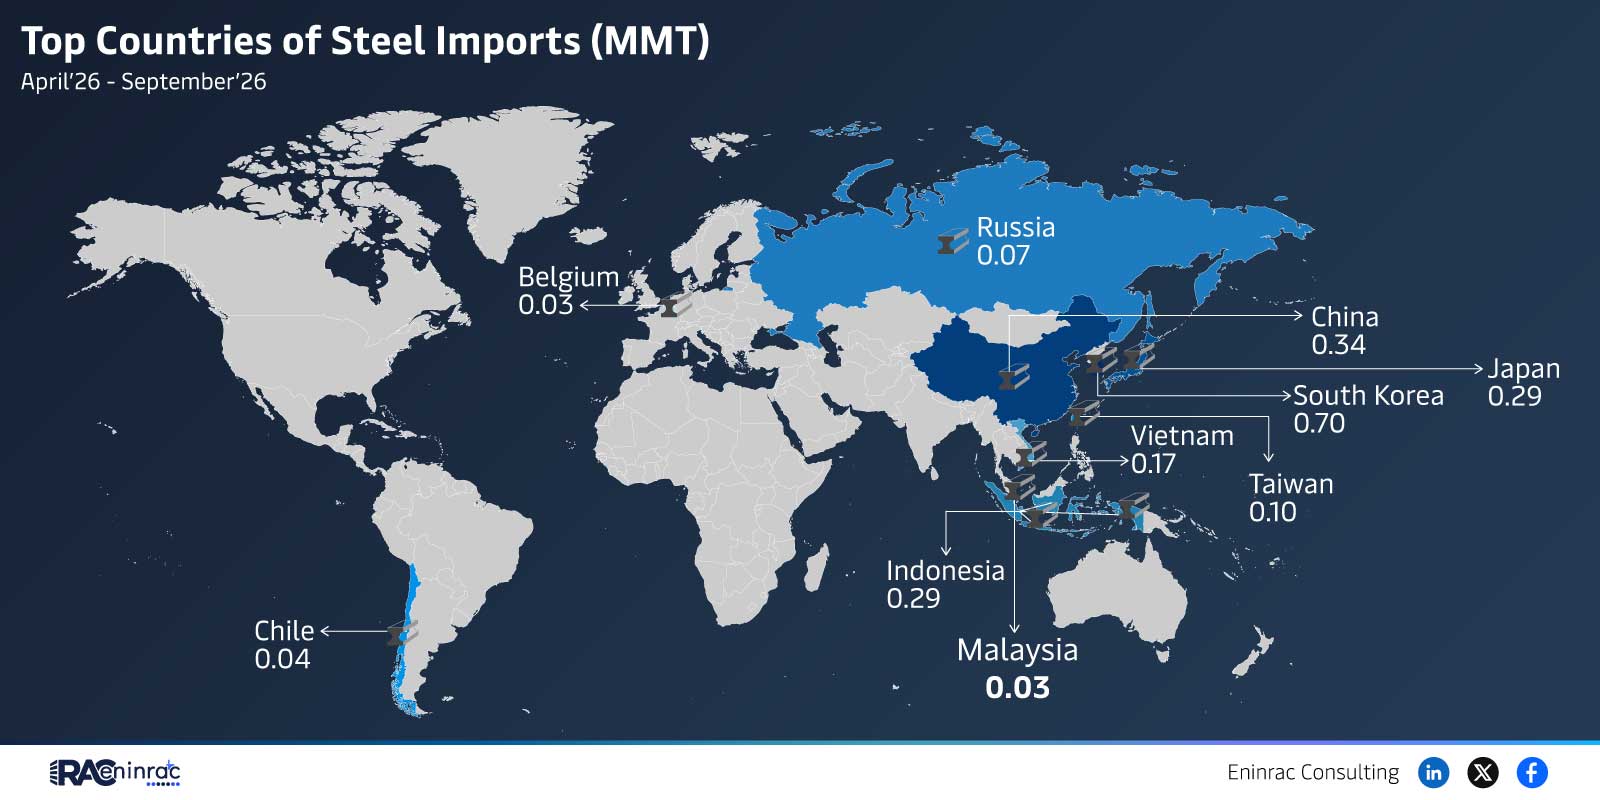
The period from April 26 to September 26 2026 saw notable shifts in global steel imports, a critical metric for manufacturers, traders and policy makers. This dataset ranks the top importing nations by million metric tons (MMT), highlighting China’s leading position with 0.34 MMT, followed closely by South Korea and Indonesia at 0.29 MMT each, while Malaysia contributed a modest 0.03 MMT. Understanding these figures helps stakeholders assess supply chain resilience, price pressures and regional demand dynamics in the broader steel market.
What Does the Data Reveal About This Topic?
The data asks: Which countries dominate steel imports in the observed window? The answer shows China leading with 0.34 MMT, while South Korea and Indonesia share the second tier at 0.29 MMT each, indicating a tightly contested mid‑range market and a relatively small contribution from Malaysia at 0.03 MMT.
Leading Steel Importers in the April‑September 2026 Period
China remains the primary destination for steel imports, accounting for roughly one‑third of the total volume recorded. South Korea and Indonesia are virtually tied, each supplying just under three‑tenths of a million metric tons, which underscores their growing manufacturing bases and reliance on external steel sources. Malaysia’s import share is minimal, reflecting either a more self‑sufficient domestic production or limited demand. The absence of a clear figure for Japan suggests either data omission or negligible activity within this specific timeframe.
Impact on Sectors and Industries
Steel imports influence a wide range of sectors including automotive, construction, machinery and renewable energy equipment. Regions with higher import volumes may face greater exposure to global price volatility and trade policy changes, while lower‑importing economies could benefit from stronger local supply chains. Investors monitor these trends to gauge profitability of steel producers, while policymakers use the data to shape tariffs, strategic reserves and sustainability initiatives.
Key Takeaways
- China leads steel imports with 0.34 MMT in the six‑month window.
- South Korea and Indonesia each import 0.29 MMT, showing strong regional demand.
- Malaysia’s import volume is modest at 0.03 MMT.
- The close values for South Korea and Indonesia suggest competitive market dynamics.
- Missing Japan data may indicate reporting gaps or low import activity.
- Import levels affect price stability, supply chain risk and investment decisions across multiple industries.
FAQs
Why is China the top importer of steel in 2026?
China’s large manufacturing sector, ongoing infrastructure projects and strategic stockpiling drive the highest steel import volume.
What does a 0.29 MMT import figure mean for South Korea and Indonesia?
It represents a significant reliance on external steel, reflecting robust construction and automotive demand in both economies.
How might low imports from Malaysia affect its steel industry?
Low import levels suggest either strong domestic production or limited demand, reducing exposure to global price swings.
What are the implications of missing Japan data?
The absence could point to reporting issues or a reduced role for Japan in steel imports during this period.
How should investors use this import data?
Investors can assess supply chain risks, anticipate price movements and identify opportunities in regions with high import reliance.