
Introduction
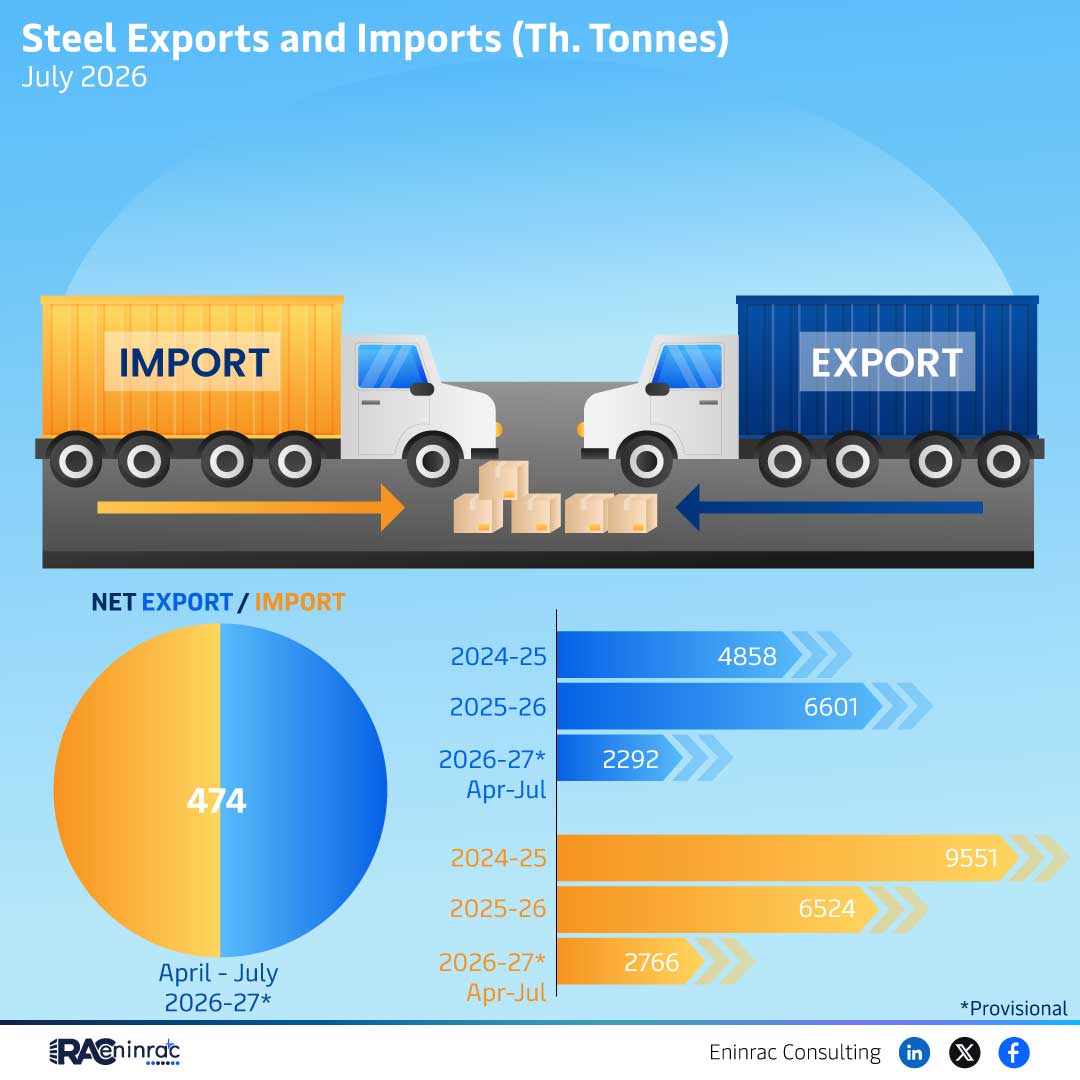
The provisional import export data for the fiscal years 2024‑25, 2025‑26 and 2026‑27 provides a snapshot of trade performance during the April‑July window. This preview helps analysts, investors and policymakers gauge the direction of net trade flows before final figures are released. Readers will learn how the numbers are structured, what trends emerge across the three periods, and why these early signals matter for strategic decisions.
What Does the Data Reveal About This Topic?
The raw figures show a shifting balance between imports and exports, with net export values toggling between modest surplus and slight deficit across the three year spans. The question many ask is whether the provisional numbers indicate a strengthening export sector or a growing reliance on imported goods. The answer lies in comparing the incremental changes from 2024‑25 through 2026‑27, especially within the key April‑July quarter that often drives annual outcomes.
April‑July Trade Trends for 2024‑27
During the April‑July period the provisional export totals rise steadily from 2024‑25 to 2026‑27, suggesting expanding market demand for domestically produced goods. Conversely, import volumes display a slower growth rate, resulting in a gradual improvement in the net export position. Regions with robust manufacturing output lead the export gains, while commodity‑rich areas maintain steady import levels. Companies that focus on high‑value added products appear to benefit most from the emerging trend, positioning them for stronger performance in the coming fiscal year.
Impact on Sectors and Industries
The evolving import export forecast influences several sectors. Manufacturing and high‑tech industries gain confidence from a rising export share, encouraging capital investment and workforce expansion. Retail and consumer goods see a moderated import flow, which can tighten supply chains but also promote local sourcing initiatives. Policy makers use the provisional data to adjust tariff structures and negotiate trade agreements, while investors monitor the figures to reallocate assets toward sectors showing export momentum.
Key Takeaways
- Provisional numbers indicate a steady rise in export volumes for the April‑July window.
- Import growth remains slower, improving the overall net export balance.
- Manufacturing hubs drive the export increase, highlighting regional strengths.
- Policy adjustments may follow the early signals to support export‑oriented industries.
- Investors can use the forecast to target high‑growth trade sectors.
- The data underscores the importance of monitoring provisional trends before final releases.
FAQs
What time frame does the provisional import export data cover?
The data focuses on the April‑July quarter for the fiscal years 2024‑25, 2025‑26 and 2026‑27.
Why are provisional figures important?
They provide early insight into trade dynamics, allowing stakeholders to make timely decisions before official statistics are published.
Which sector shows the strongest export growth?
Manufacturing, especially high‑technology and value‑added product categories, leads the export expansion.
How might policy makers respond to the trends?
They may adjust tariffs, support export incentives, and negotiate trade deals to reinforce the emerging surplus.
Can investors rely on provisional data for portfolio changes?
While provisional, the consistent upward trend offers a reasonable basis for reallocating capital toward export‑driven industries.