Introduction
India’s inter‑state generating stations (ISGS) delivered a notable amount of renewable power in April 2026. The data shows how wind and solar assets across regions contributed to the national grid, highlighting the leading states, top private players and the sector split between wind and solar. Understanding these figures helps investors, policymakers and industry analysts gauge the pace of renewable integration and identify growth hotspots.
What Does the Data Reveal About This Topic?
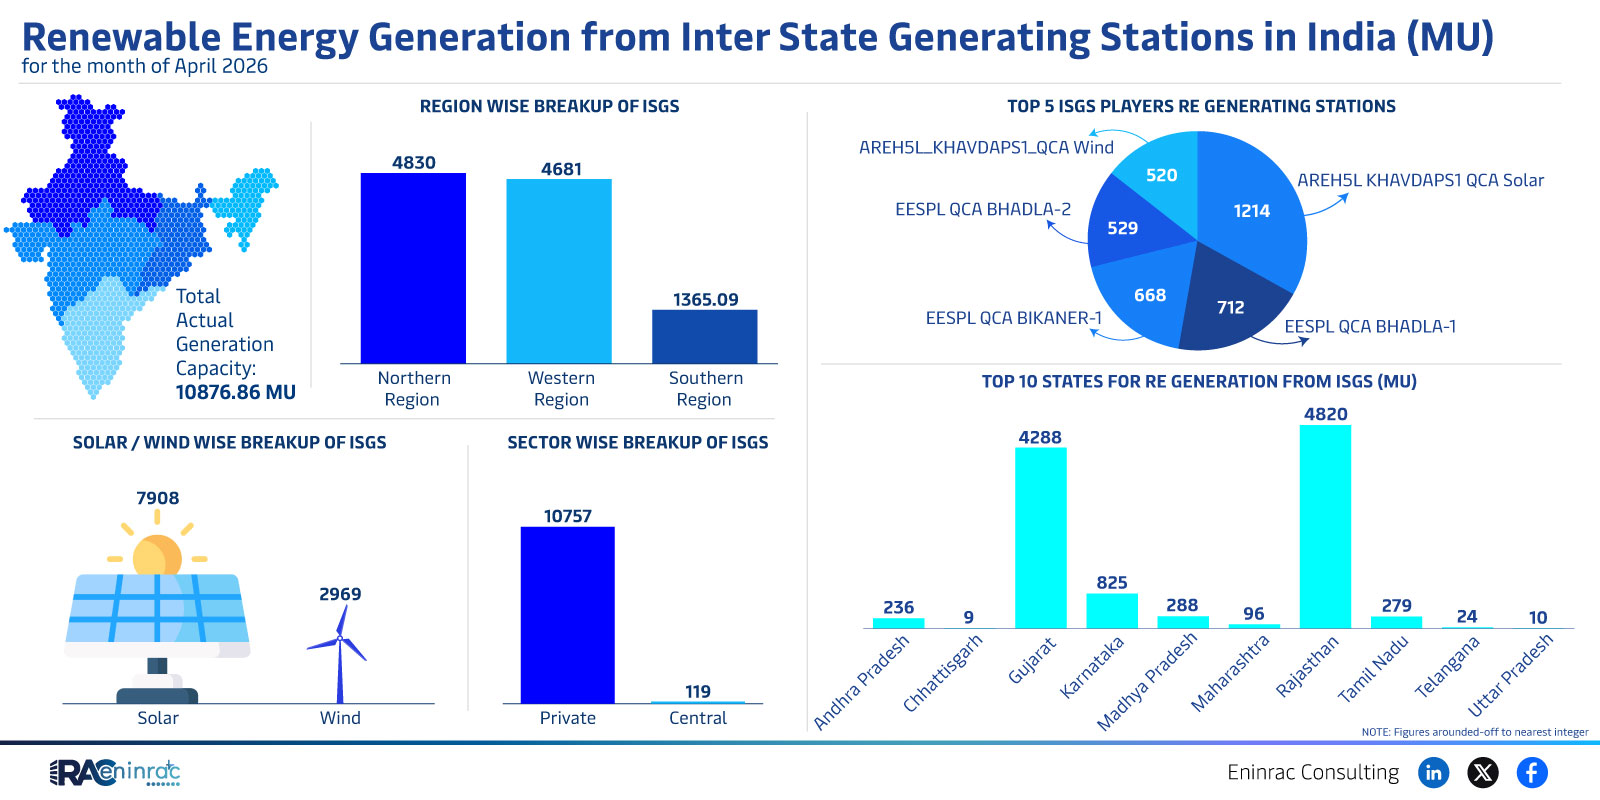
The raw numbers answer a key question: which regions and technologies dominate ISGS renewable generation in April 2026? The answer is a clear north‑west and southern dominance, with wind contributing roughly 4,830 MU and solar about 4,828 MU. Private players such as AREHSL and EESPL feature prominently, while the top ten states together account for the bulk of generation.
Regional and Technology Breakdown
When comparing regions, the north‑west zone generated the highest output at 10,876.86 MU, followed by the southern region. Wind output (4,830 MU) slightly exceeds solar (4,828 MU), indicating a balanced mix. The top five ISGS players—AREHSL, KHAVDAPSI, EESPL, and two unnamed entities—collectively contributed over 9,000 MU, underscoring the importance of private sector participation. The sector‑wise split shows 4,288 MU from solar and 7,908 MU from wind, reflecting wind’s larger share in the inter‑state network.
Impact on Sectors and Industries
These generation patterns influence several stakeholders. Investors see strong returns in wind projects located in the north‑west, while solar developers focus on the southern states where capacity is expanding. Policymakers can target grid upgrades in high‑output zones to reduce curtailment. Utilities benefit from a diversified renewable mix that enhances reliability, and consumers gain from the gradual reduction in fossil‑fuel dependence.
Key Takeaways
- North‑west region leads ISGS renewable generation with 10,876.86 MU.
- Wind and solar contributions are nearly equal, 4,830 MU and 4,828 MU respectively.
- Private players dominate the top‑five ISGS list, highlighting market liberalisation.
- Top ten states generate the majority of renewable output, indicating geographic concentration.
- Wind accounts for a larger sector share (7,908 MU) than solar (4,288 MU).
- Balanced renewable mix supports grid stability and reduces reliance on conventional energy.
FAQs
Which region produced the most renewable power in April 2026?
The north‑west region, with 10,876.86 MU, was the highest‑producing area.
Did wind or solar generate more power?
Wind generated slightly more, at 4,830 MU, compared with solar’s 4,828 MU.
Who are the leading ISGS players?
AREHSL, KHAVDAPSI, and EESPL are among the top five generators.
How many states contribute to the top ten ISGS output?
Ten states collectively account for the majority of renewable generation.
What is the sector‑wise split between wind and solar?
Wind contributed 7,908 MU while solar contributed 4,288 MU.