
Introduction
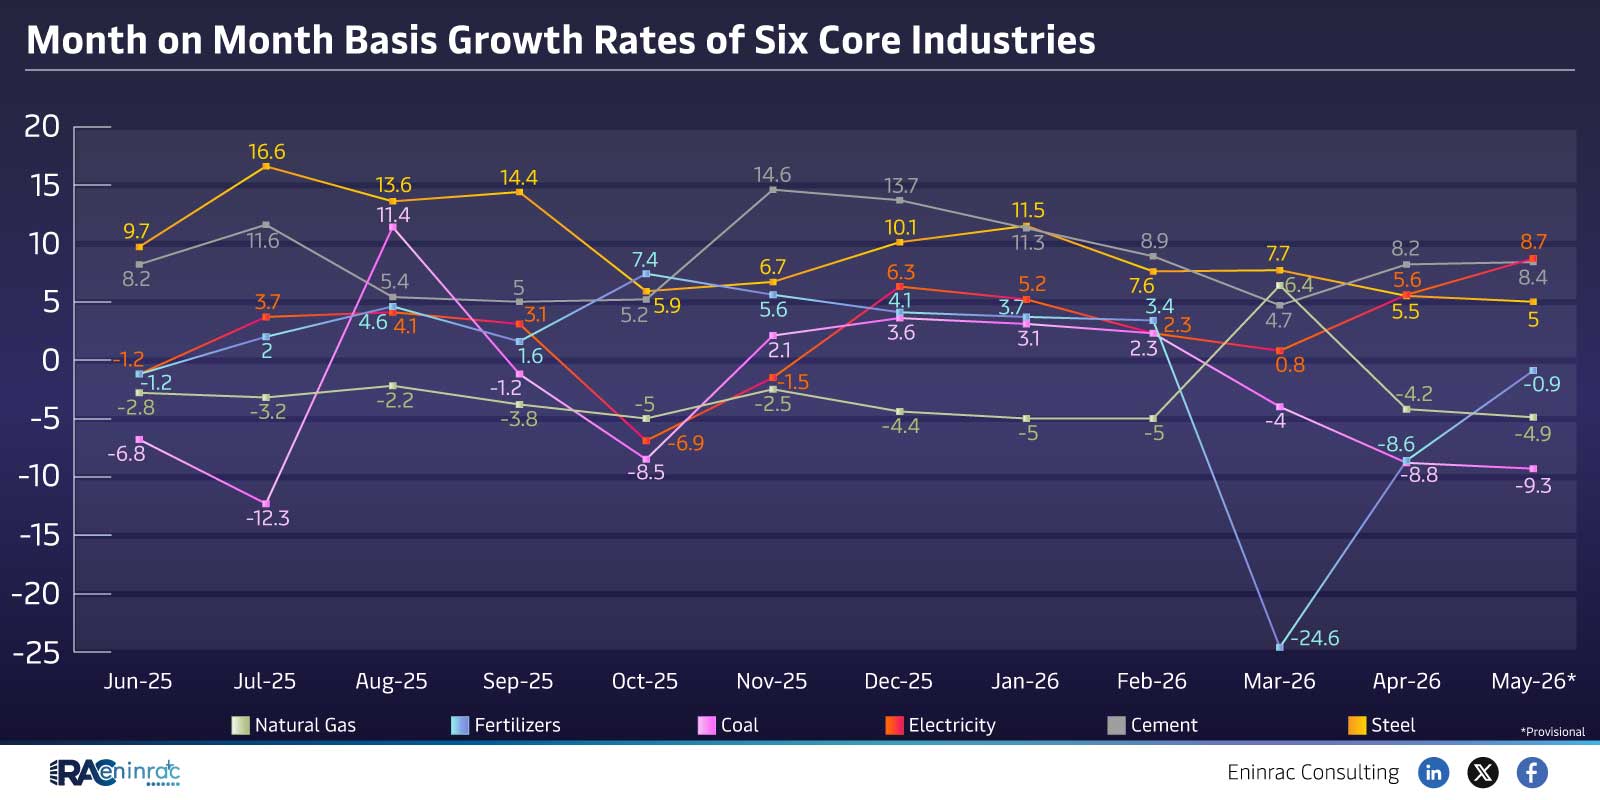
The month‑on‑month growth rates of six core industries provide a snapshot of how key sectors are performing over a twelve‑month horizon from June 2025 to May 2026. By tracking natural gas, fertilizers, coal, electricity, cement and steel, analysts can discern short‑term momentum, seasonal patterns and emerging pressure points. This data matters to investors, policymakers and business leaders seeking to adjust strategies, allocate capital and anticipate supply‑side dynamics. In the sections that follow, readers will learn what the numbers reveal, how different industries compare, and what implications arise for broader economic planning.
What Does the Data Reveal About This Topic?
The central insight is that growth is not uniform across the six industries; while some sectors register steady expansion, others experience volatility or modest contraction. The provisional figure of 16.6 % suggests an overall upward trend for the group, yet individual monthly changes differ markedly. Understanding these disparities helps answer questions such as why steel may lag behind natural gas or how electricity growth aligns with seasonal demand spikes.
Comparative Monthly Trends Across Six Core Industries
When the twelve‑month series is examined, natural gas shows the strongest cumulative increase, driven by higher demand for heating and power generation in colder months. Fertilizer production follows, benefitting from agricultural cycles. Coal exhibits a more erratic pattern, reflecting policy shifts toward cleaner energy. Electricity growth aligns with peak summer usage, while cement and steel, both construction‑linked, display modest, steady gains with occasional dips during holiday periods. These contrasts illustrate the distinct drivers that shape each industry's month‑on‑month performance.
Impact on Sectors and Industries
Investors can use these growth rates to rebalance portfolios, emphasizing sectors with higher momentum such as natural gas and fertilizers while hedging exposure to more volatile coal. Policymakers may calibrate subsidies or regulatory measures to support lagging sectors like steel, ensuring infrastructure goals are met. Business leaders in construction can anticipate cement supply trends, and utilities can plan electricity procurement based on seasonal growth spikes. Overall, the data empowers stakeholders to make evidence‑based decisions that align with short‑term market realities.
Key Takeaways
- Natural gas leads the six‑core group with the highest cumulative month‑on‑month growth.
- Fertilizer growth is closely tied to agricultural planting cycles.
- Coal shows pronounced volatility due to policy and environmental pressures.
- Electricity growth peaks during summer months, reflecting demand patterns.
- Cement and steel maintain steady but lower growth, mirroring construction seasonality.
- The aggregate 16.6 % provisional increase signals robust overall sectoral expansion.
FAQs
What time period does the growth data cover?
The data spans twelve months from June 2025 through May 2026.
Why does coal growth appear more volatile than other sectors?
Coal is affected by shifting energy policies, environmental regulations and fluctuating demand for thermal power.
How can investors use this month‑on‑month data?
Investors can identify fast‑growing sectors, adjust exposure, and time entry or exit points based on short‑term trends.
What drives the seasonal peaks in electricity growth?
Seasonal temperature extremes increase heating and cooling demand, leading to higher electricity consumption.
Is the 16.6 % figure an average or total growth?
The 16.6 % figure represents the provisional overall increase across all six core industries for the period.