
Introduction
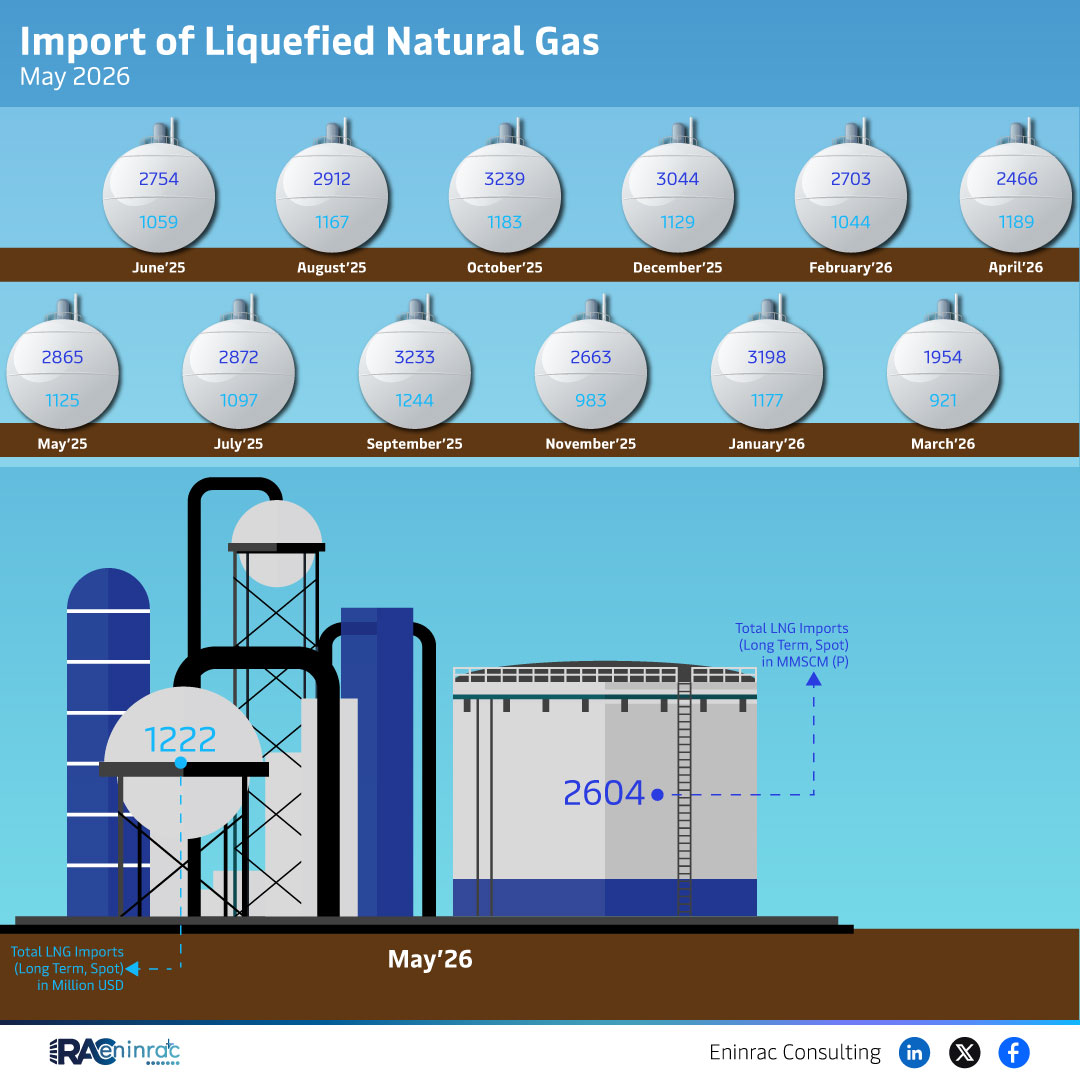
The May 2026 import data for liquefied natural gas (LNG) provides a clear snapshot of how global markets are balancing long‑term contracts with spot purchases. Understanding these figures is essential for investors, policymakers, and industry analysts who track energy security and price dynamics. This article explains what the numbers reveal, highlights key trends, and outlines the implications for the broader energy sector.
What Does the Data Reveal About This Topic?
The raw data shows total LNG imports in May 2026 measured in MMSCM (million standard cubic meters per day) for both long‑term and spot contracts. The primary insight is the relative share of each supply type, indicating whether buyers are securing stable volumes through contracts or relying on market flexibility. This balance reflects confidence in supply chains, pricing strategies, and regional demand shifts.
May 2026 LNG Import Trends by Contract Type
When comparing long‑term and spot imports, the data suggests a modest increase in spot volume compared with the previous month, while long‑term volumes remain steady. This pattern often points to short‑term market tightening or price arbitrage opportunities. Regions with growing industrial demand, such as East Asia, tend to increase spot purchases, whereas Europe may rely more heavily on established long‑term agreements to hedge against price volatility. The contrast underscores how geography and contract strategy influence overall import levels.
Impact on Sectors and Industries
Fluctuations in LNG import volumes affect multiple sectors. Power generators assess fuel availability and cost, while petrochemical firms gauge feedstock stability. Investors watch these trends to gauge earnings potential for LNG traders and infrastructure developers. Policymakers also use the data to evaluate energy security, especially in regions transitioning from coal to cleaner fuels. The balance between long‑term and spot imports can signal future infrastructure investments, such as new regasification terminals or pipeline expansions.
Key Takeaways
- May 2026 total LNG imports are reported in MMSCM, covering both long‑term and spot deliveries.
- Spot volume shows a modest rise, indicating heightened short‑term market activity.
- Long‑term contracts remain stable, reflecting ongoing supply confidence.
- East Asian demand drives spot purchases, while Europe leans on long‑term contracts.
- Import trends influence power generation, petrochemical feedstock, and investment decisions.
- Policymakers monitor these numbers to ensure energy security and plan infrastructure.
FAQs
What does MMSCM measure in LNG reports?
MMSCM stands for million standard cubic meters per day, a common unit for daily LNG flow rates.
Why are spot LNG purchases increasing?
Spot purchases often rise when short‑term price differentials create arbitrage opportunities or when unexpected demand spikes occur.
How do long‑term contracts affect price stability?
Long‑term contracts lock in prices and volumes, helping buyers avoid sudden market swings and ensuring steady supply.
Which regions are the biggest LNG importers in May 2026?
East Asia, Europe, and parts of South America lead in LNG imports, each with distinct contract strategies.
What implications does the May 2026 data have for investors?
Investors watch the balance of contract types to gauge market sentiment, forecast earnings for LNG traders, and assess infrastructure investment needs.