
Introduction
India's renewable energy generation in July 2026 reached a pivotal milestone, showcasing the country's accelerating shift toward clean power. The data highlights contributions from solar, wind, hydro and biomass sources, offering a snapshot of how the renewable mix is evolving. Readers will learn the key figures, underlying trends, and what this momentum means for investors, policymakers and the broader energy market.
What Does the Data Reveal About This Topic?
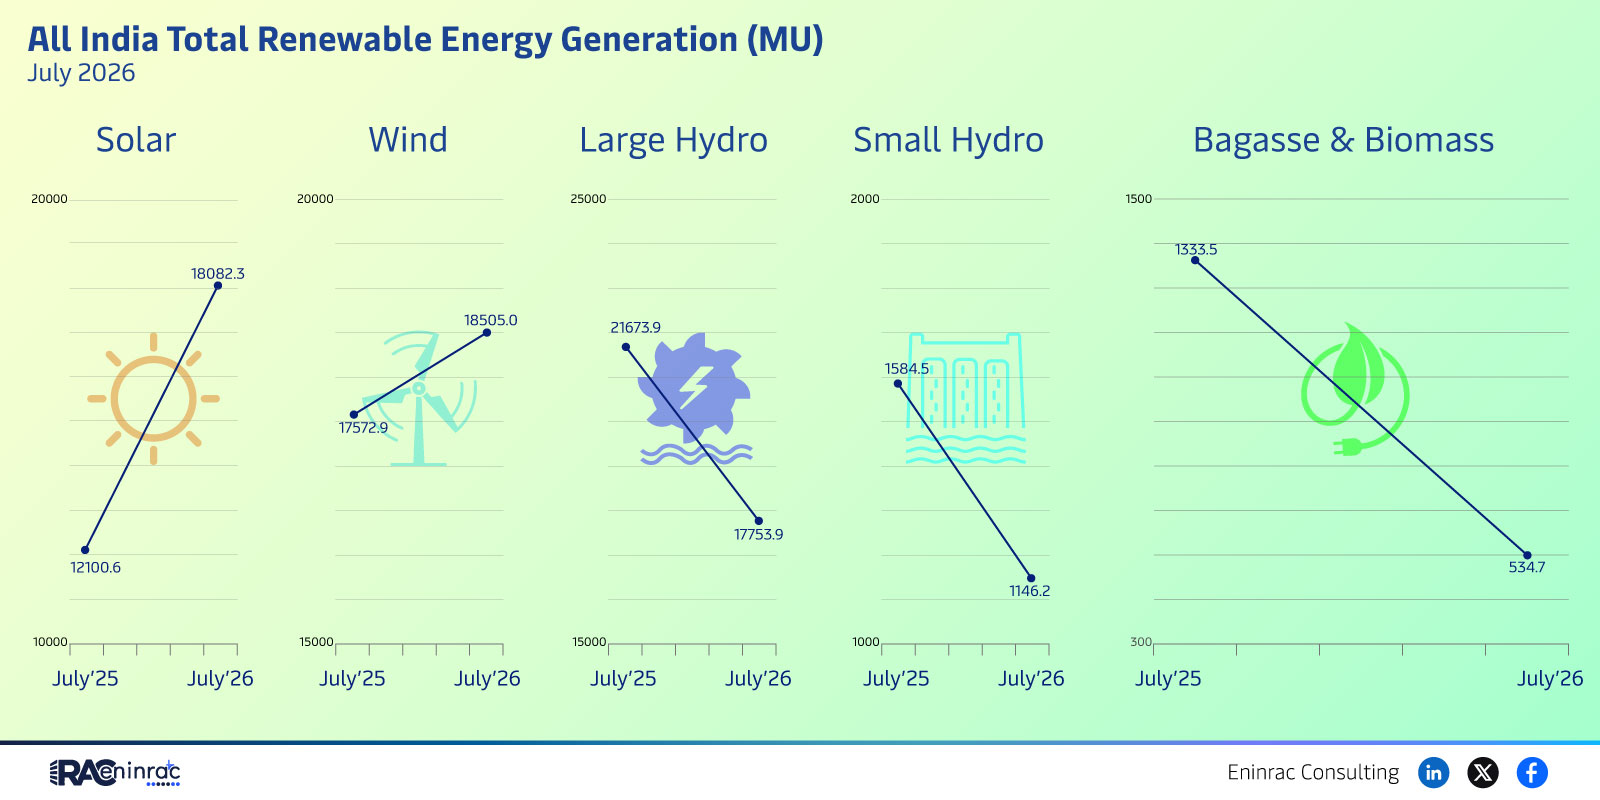
How much renewable power did India generate in July 2026? The month recorded 20,000 megawatt‑hours (MU) from solar, an equal 20,000 MU from wind, 25,000 MU from large hydro, 2,000 MU from small hydro and 1,500 MU from bagasse and biomass. Together these sources contributed over 68,500 MU, underscoring a balanced and diversified renewable portfolio that supports the nation’s climate objectives.
July 2026 Renewable Generation by Source
A comparative look shows solar and wind each delivering 20,000 MU, indicating that photovoltaic and turbine installations are scaling at comparable rates. Large hydro remains the single largest contributor at 25,000 MU, reflecting the continued reliance on existing dam infrastructure. Small hydro and biomass together add modest yet important volumes, illustrating niche roles for decentralized and waste‑derived energy. The data also hints at regional dynamics, with northern states leading solar deployment while coastal zones drive wind output.
Impact on Sectors and Industries
The surge in renewable generation influences multiple facets of the Indian economy. Utilities are integrating higher shares of intermittent power, prompting investment in grid flexibility and storage solutions. Manufacturing firms benefit from lower carbon footprints, enhancing export competitiveness in sustainability‑focused markets. Financial institutions see expanding opportunities in green bonds and renewable project financing, while policymakers gain concrete evidence to refine targets under the National Solar Mission and the broader Renewable Energy Act. Consumers enjoy increasingly affordable clean electricity as economies of scale lower generation costs.
Key Takeaways
- Solar and wind each contributed 20,000 MU, showing balanced growth across the two largest renewable sectors.
- Large hydro remained the top single source with 25,000 MU, highlighting the importance of existing dam assets.
- Overall renewable output in July 2026 exceeded 68,500 MU, reinforcing India's commitment to a low‑carbon trajectory.
- Small hydro and biomass together added 3,500 MU, underscoring the role of distributed and waste‑derived energy.
- The diversified mix reduces reliance on any single technology, improving grid resilience.
- Strong performance provides a compelling narrative for investors, policymakers and businesses seeking renewable opportunities.
FAQs
What were the top renewable sources in July 2026?
Large hydro, solar and wind each generated the highest volumes, with hydro leading at 25,000 MU.
How does July 2026 compare to previous months?
The month marked a steady increase in solar and wind output compared with earlier quarters, reflecting continued capacity additions.
What does the biomass contribution indicate?
Bagasse and biomass supplied 1,500 MU, showing that waste‑to‑energy remains a viable niche in India's renewable mix.
Why is the renewable mix important for grid stability?
A balanced contribution from solar, wind, hydro and biomass reduces intermittency risk and supports smoother power delivery.
How can investors use this data?
The figures highlight growth sectors, guiding capital allocation toward solar, wind and hydro projects with strong policy backing.