Introduction
The April 2026 report on India’s thermal and nuclear power generation provides a snapshot of regional performance across the country. Understanding how each region contributes to the national grid helps policymakers, investors, and industry analysts gauge capacity utilization, identify growth opportunities, and plan future energy projects.
What Does the Data Reveal About This Topic?
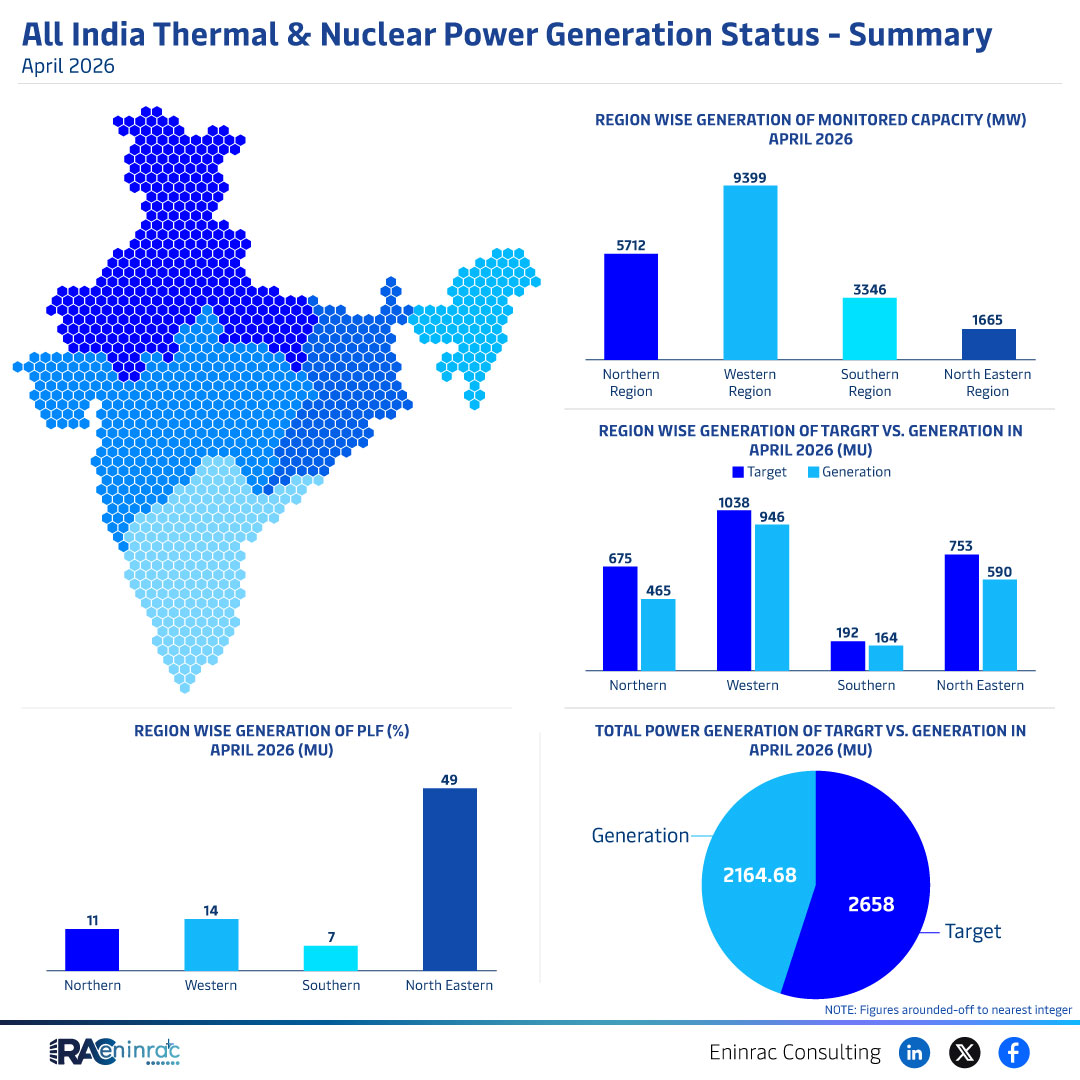
The data shows that the Northern region generated the highest output at 2,164.68 MW, surpassing its target of 1,038 MW. Western, Southern and North Eastern regions also exceeded their targets, indicating strong overall generation performance in April 2026.
Regional Generation Comparison for April 2026
When comparing regions, the Northern zone leads with more than double the generation of the Western region (1,665 MW) and significantly higher than Southern (1,038 MW) and North Eastern (753 MW). The gap highlights the concentration of thermal and nuclear assets in the north, while the western and southern zones are catching up through newer capacity additions.
Impact on Sectors and Industries
Higher than expected generation improves grid reliability, supports industrial activity, and reduces reliance on imported fuels. Investors see reduced risk in conventional energy projects, while policymakers can prioritize infrastructure upgrades in lagging regions. Consumers benefit from more stable electricity supply and potentially lower tariffs.
Key Takeaways
- Northern region leads with 2,164.68 MW generation, far above its target.
- All regions exceeded their generation targets in April 2026.
- Regional disparities suggest a need for balanced capacity expansion.
- Strong performance supports industrial growth and grid stability.
- Investors gain confidence in conventional energy projects.
- Policymakers can use the data to target infrastructure improvements.
FAQs
Which region generated the most power in April 2026?
The Northern region generated the most power, delivering 2,164.68 MW.
Did any region fall short of its generation target?
No, all four regions—Northern, Western, Southern, and North Eastern—exceeded their respective targets.
What does PLF stand for in the report?
PLF stands for Plant Load Factor, a measure of actual output versus maximum possible output.
How does this data affect energy investors?
Exceeding targets signals strong operational performance, reducing perceived risk and attracting investment in conventional energy assets.
What actions can policymakers take based on this data?
Policymakers can focus on expanding capacity in lower‑performing regions and improving transmission infrastructure to balance supply.