
Introduction
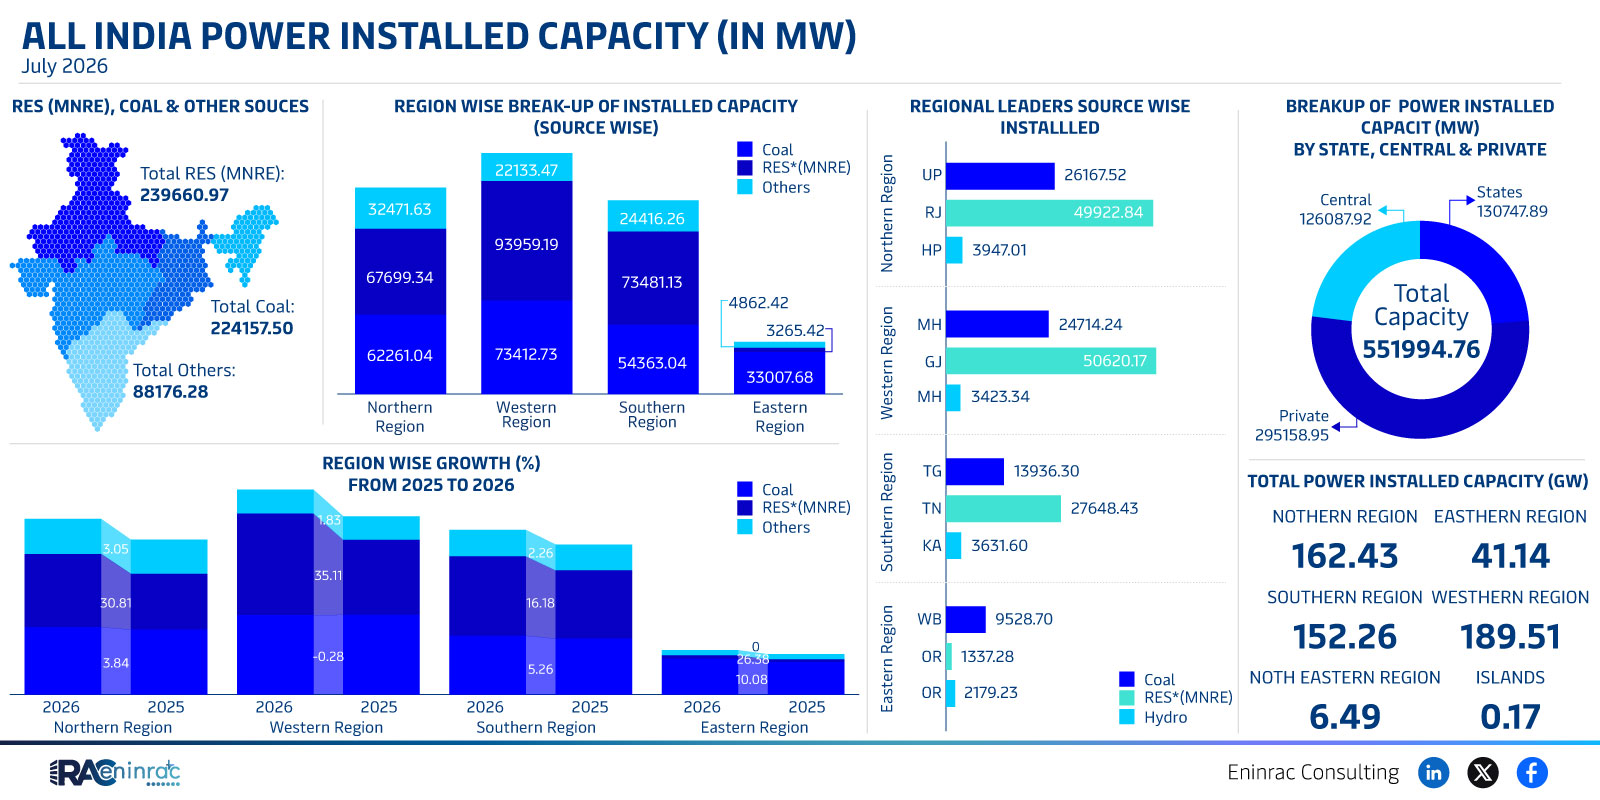
The July 2026 snapshot of India’s power installed capacity reveals a complex mix of renewable and conventional sources spread across the country’s four major regions. With a total capacity of 551,995 MW, the energy landscape reflects both the nation’s aggressive renewable push and its continued reliance on coal. Stakeholders can assess capacity gaps and future demand projections based on this snapshot. Understanding India power installed capacity trends helps align strategic decisions. This article unpacks the raw figures, compares regional performance, highlights growth from 2025 to 2026, and explains what the data means for investors, policymakers, and industry stakeholders.
What Does the Data Reveal About This Topic?
In a question‑answer style, the data shows that renewable energy (RES) contributed 239,661 MW while coal added 224,158 MW to the national grid. The remaining capacity is split among hydro, other sources, and private installations. The regional breakdown indicates that the Western and Northern zones together hold more than half of the total capacity, while the Southern and Eastern zones each account for roughly one‑third of the remainder. Growth between 2025 and 2026 is strongest in the Western region, driven by new solar and wind projects.
Regional Capacity Comparison for July 2026
The Northern region records 162.43 GW, the Eastern region 41.14 GW, the Southern region 152.26 GW, and the Western region leads with 189.51 GW. When expressed in megawatts, these translate to 162,430 MW, 41,140 MW, 152,260 MW, and 189,510 MW respectively. The Western zone’s dominance is reinforced by a substantial private sector contribution of 295,159 MW nationwide, while state‑run capacity stands at 730,748 MW. Among states, Rajasthan (49,923 MW) and Maharashtra (24,714 MW) top the list, followed by Karnataka (3,632 MW) and Tamil Nadu (9,529 MW). The data also shows a modest island capacity of 6.49 GW, highlighting emerging opportunities in offshore and island grids. The Southern region’s steady growth is driven by recent hydro projects and increased private participation.
Impact on Sectors and Industries
These capacity figures influence a wide array of sectors. Renewable developers can target the Western region for new solar farms, while coal‑centric businesses may focus on the Northern and Southern zones where existing infrastructure is robust. Financial analysts see the private capacity surge as a signal of growing confidence in independent power producers. Policymakers can use the regional growth differentials to tailor incentives, grid upgrades, and transmission planning, ensuring that both clean and conventional generation integrate smoothly. The data also signals investment opportunities in grid modernization and storage solutions as the mix shifts.
Key Takeaways
- India’s total installed power capacity reached 551,995 MW in July 2026.
- Renewable energy accounts for 239,661 MW, representing roughly 43% of the mix.
- Coal remains a major source with 224,158 MW, about 41% of total capacity.
- The Western region holds the highest capacity at 189.51 GW, leading growth trends.
- Private sector capacity (295,159 MW) surpasses state‑run capacity in scale.
- Regional growth from 2025 to 2026 is strongest in the West, driven by solar and wind additions.
FAQs
What was India’s total power capacity in July 2026?
The country installed 551,995 MW of power capacity, combining renewable, coal, hydro, and private sources.
How much renewable energy capacity was installed?
Renewable sources contributed 239,661 MW, making up about 43% of the overall capacity.
Which region has the highest installed capacity?
The Western region leads with 189.51 GW, followed by the Northern and Southern regions.
What role does the private sector play in India’s power mix?
Private installations amount to 295,159 MW, indicating a significant share of the nation’s generation assets.
Are there growth trends visible between 2025 and 2026?
Yes, the Western region shows the strongest year‑on‑year growth, primarily due to new solar and wind projects.